Spring Sale Special Limited Time 70% Discount Offer - Ends in 0d 00h 00m 00s - Coupon code: buysanta

Exact2Pass Menu

SAS Statistical Business Analysis SAS9: Regression and Model

Last Update 18 hours ago Total Questions : 99

The SAS Statistical Business Analysis SAS9: Regression and Model content is now fully updated, with all current exam questions added 18 hours ago. Deciding to include A00-240 practice exam questions in your study plan goes far beyond basic test preparation.

You'll find that our A00-240 exam questions frequently feature detailed scenarios and practical problem-solving exercises that directly mirror industry challenges. Engaging with these A00-240 sample sets allows you to effectively manage your time and pace yourself, giving you the ability to finish any SAS Statistical Business Analysis SAS9: Regression and Model practice test comfortably within the allotted time.

Question # 11

The standard form of a linear regression model is:

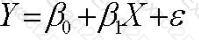
Which statement best summarizes the assumptions placed on the errors?

A.

The errors are correlated, normally distributed with constant mean and zero variance.

B.

The errors are correlated, normally distributed with zero mean and constant variance.

C.

The errors are independent, normally distributed with constant mean and zero variance.

D.

The errors are independent, normally distributed with zero mean and constant variance.

Question # 12

Which SAS program will detect collinearity in a multiple regression application?

A.

Option A

B.

Option B

C.

Option C

D.

Option D

Question # 13

Refer to the following exhibit:

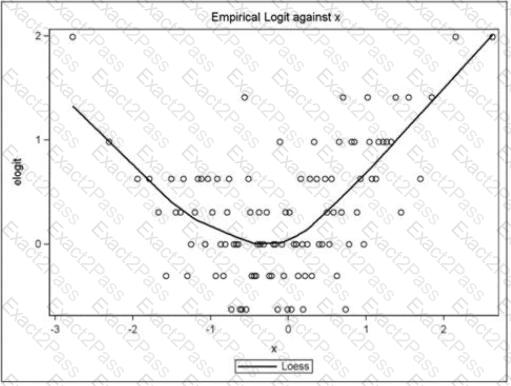
What is a correct interpretation of this graph?

A.

The association between the continuous predictor and the binary response is quadratic.

B.

The association between the continuous predictor and the log-odds is quadratic.

C.

The association between the continuous predictor and the continuous response is quadratic.

D.

The association between the binary predictor and the log-odds is quadratic.

Question # 14

Given the following LOGISTIC procedure:

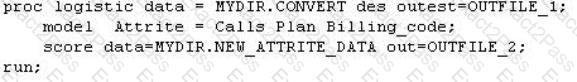
What is the difference between the datasets OUTFILEJ and OUTFILE_2?

A.

OUTFILE_1 contains the final parameter estimates while OUTFILE_2 contains the newly scored probabilities.

B.

OUTFILE_1 contains the model goodness of fit statistics while OUTFILE_2 contains the newly scored probabilities

C.

OUTFILE_1 contains the model goodness of fit statistics while OUTFILE_2 contains the newly scored logits.

D.

OUTFILEJ contains the final parameter estimates and Wald Chi-Square values while OUTFILE_2 contains the newly scored probabilities.

Question # 15

What is a benefit to performing data cleansing (imputation, transformations, etc.) on data after partitioning the data for honest assessment as opposed to performing the data cleansing prior to partitioning the data?

A.

It makes inference on the model possible.

B.

It is computationally easier and requires less time.

C.

It omits the training (and test) data sets from the benefits of the cleansing methods.

D.

It allows for the determination of the effectiveness of the cleansing method.

Question # 16

Refer to the REG procedure output:

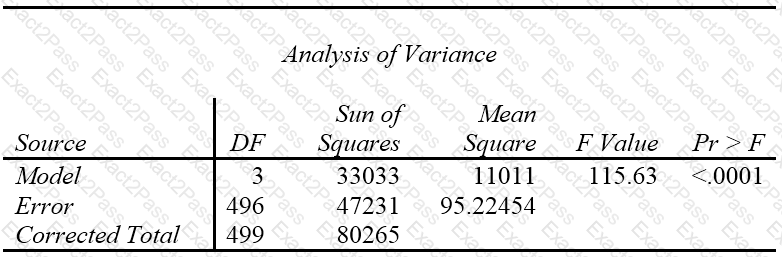
Calculate the coefficient of determination, R-Square.

Enter your numeric answer in the space below. Round to 4 decimal places (example: n.nnnn).

Question # 17

Refer to the lift chart:

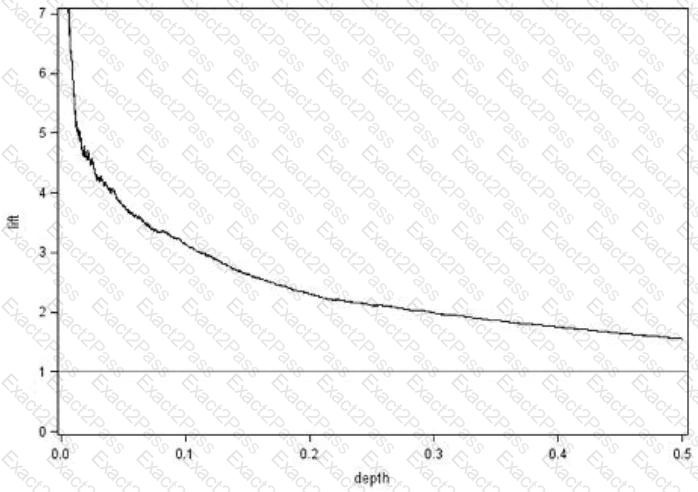
At a depth of 0.1, Lift = 3.14. What does this mean?

A.

Selecting the top 10% of the population scored by the model should result in 3.14 times more events than a random draw of 10%.

B.

Selecting the observations with a response probability of at least 10% should result in 3.14 times more events than a random draw of 10%.

C.

Selecting the top 10% of the population scored by the model should result in 3.14 times greater accuracy than a random draw of 10%.

D.

Selecting the observations with a response probability of at least 10% should result in 3.14 times greater accuracy than a random draw of 10%.

Question # 18

This question will ask you to provide a missing option.

A business analyst is investigating the differences in sales figures across 8 sales regions. The analyst is interested in viewing the regression equation parameter estimates for each of the design variables.

Which option completes the program to produce the regression equation parameter estimates?

A.

Solve

B.

Estimate

C.

Solution

D.

Est

Question # 19

Screening for non-linearity in binary logistic regression can be achieved by visualizing:

A.

A scatter plot of binary response versus a predictor variable.

B.

A trend plot of empirical logit versus a predictor variable.

C.

A logistic regression plot of predicted probability values versus a predictor variable.

D.

A box plot of the odds ratio values versus a predictor variable.

Question # 20

When working with smaller data sets (N < 200), which method is preferred to perform honest assessment?

A.

Training: 40% Validation: 30% Testing: 30%

B.

K-fold cross validation

C.

Cross validation using 4th quartile observations

D.

Use the AIC goodness of fit statistic

Go to page: