Labour Day Sale Limited Time 70% Discount Offer - Ends in 0d 00h 00m 00s - Coupon code: buysanta

Exact2Pass Menu

Question # 4

With Measurement System Analysis we are concerned with two issues that impact the potential variability of the data. They are ____________ and Accuracy.

A.

Spread

B.

Reliability

C.

Precision

D.

Deflection

Full Access
Question # 5

For her injection molding project a Belt needed to track the percentage of defectives of a particular sample set so she used a ___________ to display the data?

A.

Individual Chart

B.

C Chart

C.

Xbar Chart

D.

P Chart

Full Access
Question # 6

If you can Poka-Yoke a defect out of the process entirely then you do not need use SPC on the characteristic of interest in the defect.

A.

True

B.

False

Full Access
Question # 7

A(n) ________________ has occurred when two inputs have a greater impact on a change in the output than either of the inputs has by itself.

A.

Dependency

B.

Bimodal reaction

C.

Interaction

D.

Amplified effect

Full Access
Question # 8

A ___________ problem in the Measurement System suggests that there is a lack of consistency in the measurement over time.

A.

Linearity

B.

Bias

C.

Stability

D.

Magnitude

Full Access
Question # 9

The method of Steepest Ascent guides you toward a target inside the original inference space.

A.

True

B.

False

Full Access
Question # 10

For Attribute Data, Process Capability is defined as the average proportion of nonconforming products.

A.

True

B.

False

Full Access
Question # 11

The _______ is the most frequently occurring value in a distribution of data.

A.

Median

B.

Mean

C.

Mode

D.

Center Point

Full Access
Question # 12

Customers make their decisions based on Features, Integrity (of the seller) Delivery and ___________?

A.

Color

B.

Expense

C.

Season

D.

None

Full Access
Question # 13

Use this data to calculate the Z score. Average oF. 65, Standard Deviation: 3, Upper Spec Limit: 72

A.

0.27

B.

1.5

C.

2.33

D.

4.12

Full Access
Question # 14

On a _________________ one can see a pattern from the graphed points such that conclusions can be drawn about the largest family of Variation.

A.

Multi-Vari Chart

B.

Weighted Scale

C.

X-Y Matrix

D.

Poisson Chart

Full Access
Question # 15

For the data set shown here which of these statements is/are true?

A.

Hypothesis Testing of Means or Medians cannot be done since there are an unequal number of observations for the 3 samples

B.

A Paired T-test would be applicable for comparing Grade B and Grade A since they follow each other in the data set

C.

Grade A has the lowest sample Mean of the 3 samples

D.

Grade A has a higher sample Mean than Grade B

Full Access
Question # 16

A Belt rearranged the location of the parts inventory for a rework station locating the most often used parts to be within hand reach of the repair person. This rearrangement resulted in quicker repair times by eliminating one of seven major elements of waste which is the Waste of __________.

A.

Motion

B.

Conveyance

C.

Inventory

D.

Waiting

Full Access
Question # 17

A ___________ problem in the Measurement System suggests that there is a lack of consistency in the measurement over time.

A.

Linearity

B.

Bias

C.

Stability

D.

Magnitude

Full Access
Question # 18

Range Charts are the technique used to determine if Special Causes are occurring within the subgroups of the ______________.

A.

Histograms

B.

SPC Charts

C.

NP Charts

D.

Pareto Charts

Full Access
Question # 19

When a Belt Poka-Yoke’s a defect out of the process entirely then she should track the activity with a robust SPC system on the characteristic of interest in the defect as an early warning system.

A.

True

B.

False

Full Access
Question # 20

Accuracy can be assessed in several ways and a fairly accurate means of measurement is visual comparison.

A.

True

B.

False

Full Access
Question # 21

A valid Multiple Linear Regression (MLR) is characterized by all of these except _______________________.

A.

It is an assumption that the X’s (inputs) are not correlated to each other

B.

The X’s (inputs) are assumed to be independent of each other

C.

MLR is conducted based on a deliberate form of experimentation

D.

The Residuals from MLR analysis have to be Normally Distributed

Full Access
Question # 22

The method of Steepest Ascent guides you toward a target inside the original inference space.

A.

True

B.

False

Full Access
Question # 23

The calculation of Column Total times Row Total divided by Grand Total yields expected values from what type of chart?

A.

Pareto Chart

B.

Sakami Table

C.

Contingency Table

D.

None

Full Access
Question # 24

The reported Cpk for a process with an average of 98 units, a spread of 16 units and upper and lower specification limits of 115 and 90 units would be?
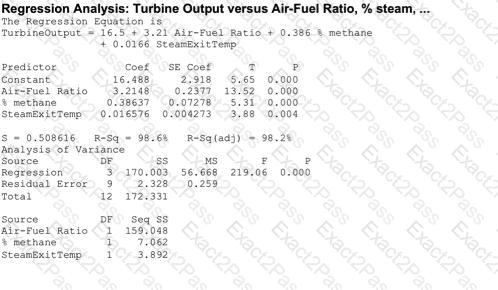
A.

0.5

B.

0.75

C.

1.00

D.

1.25

Full Access
Question # 25

Which of these is not a primary cause for Non-normal Data?

A.

Skewness

B.

Mixed Distributions

C.

Kurtosis

D.

Formulosis

E.

Granularity

Full Access
Question # 26

Control Charts were developed by Dr. Shewhart to track data over time. To detect Special Cause variation the Control Charts use which of these?

A.

Data shift analysis

B.

Outlier analysis methods

C.

Center Line and Control Limits

D.

None of the above

Full Access
Question # 27

In a good Measurement System the most variation will be with part-to-part measurements. What should you do if the majority of variation is associated with the Gage R&R assuming the gage is technically capable?

A.

Focus on fixing the Repeatability and Reproducibility of the measurement device

B.

Purchase a new machine

C.

Focus on trimming the Part-to-Part variation

D.

Run another MSA test with the machine

Full Access
Question # 28

A dock worker for a feed supplier was tasked with assuring the proper weight in the feed bags as they left the dock. One of the columns listed the range of weight of the bags included in the studies. This required plotting a Histogram of the weight of the bags. While drawing the Histogram the x-axis contained a certain scale of data. Pick the scale of data that is appropriate for Histograms.

A.

Ordinal Scale Data

B.

Interval Scale Data

C.

Nominal Scale Data

D.

Ration Scale Data

Full Access
Question # 29

Which statement(s) are correct about the DOE Factorial plot output here? (Note: There are 3 correct answers).

A.

Two factors were operated at 3 levels each

B.

The highest tool age was achieved with metal hardness at high level while keeping the cutting speed at the low level

C.

The design indicated above is a 32 factorial design

D.

The cutting speed and cutting angle are at the low level for the least tool age achieved

E.

All factors had 2 levels in the experiment

Full Access
Question # 30

Much of the Six Sigma methodology is used to identify and remove causes for _____________ .

A.

Process Variation

B.

Material Costs

C.

Excess Inventory

D.

Lost Sales

Full Access
Question # 31

Fractional Factorial, ____________and Response Surface Method are types of planned experiments.

A.

Multi-Vari Analysis

B.

Baldridge Channels

C.

One Factor at a Time or OFAT

D.

Factorial Design

Full Access
Question # 32

All the data points that represent the total set of information of interest is called the ________________ .

A.

Population

B.

Sample

C.

Frame

D.

Spread

Full Access
Question # 33

Using this partial Z Table, how many units from a month’s production run are expected to not satisfy customer requirements for the following process?

Upper specification limit: 7.2 Lower specification limit: 4.3 Mean of the process: 5.9 Standard Deviation: 0.65 Monthly production: 450 units

A.

3

B.

7

C.

10

D.

12

Full Access
Question # 34

Appropriate measures means that measurements are ______________.

A.

Representative

B.

Sufficient

C.

Contextual

D.

Relevant

E.

All of these answers are correct

Full Access
Question # 35

When a Belt properly analyzes the results of an experiment he must examine the Residuals in expectation of finding all of the following except _________.

A.

Some Residuals higher than others

B.

Some Residuals lower than others

C.

All Residuals within 2 Standard Deviations of the Mean

D.

Residuals will represent a Linear Regression

Full Access
Question # 36

The Japanese born function of a Kanban event utilizes a specific, step-by-step approach meant to bring about major changes to a process.

A.

True

B.

False

Full Access
Question # 37

Using this data calculate the percentage of DPU.

A.

2.74

B.

3.23

C.

4.56

D.

5.93

Full Access
Question # 38

Measurement __________ is defined as the difference between the observed and the expected values for a given set of data.

A.

Breadth

B.

Linearity

C.

Range

D.

Bias

Full Access
Question # 39

Common and Special Cause ______________ are the focus of Statistical Process Control.

A.

Prediction

B.

Ideation

C.

Capability

D.

Variation

Full Access
Question # 40

As a means of measuring the effects on other areas of a process as a result of changes in the primary metric we also define and track ________________.

A.

Parallel process metrics

B.

Secondary metrics

C.

Tertiary metrics

D.

Industry standards

Full Access
Question # 41

A fundamental rule is that both Standard Deviation and Variance can be added.

A.

True

B.

False

Full Access
Question # 42

For a Normal Distribution as samples size increases the Range in Mean and Standard Deviation decrease relative to the Mean and Standard Deviation of the population.

A.

True

B.

False

Full Access
Question # 43

Which statements are correct about the advanced Capability Analysis shown here? (Note: There are 3 correct answers).

A.

This is a Poisson Capability Analysis

B.

The average DPU with 95% confidence is between 0.024 and 0.0295

C.

The DPU does not seem to vary depending on sample size

D.

The process shows only one instance of being out of control statistically so we have confidence in the estimated DPU of this process

E.

The maximum DPU in one observation was nearly 0.0753

Full Access
Question # 44

A Belt working in a supply chain environment has to make a decision to change suppliers of critical raw materials for a new product upgrade. The purchasing manager is depending on the Belt’s effort requiring that the average cost of an internal critical raw material component be less than or equal to $4,200 in order to stay within budget. Using a sample of 35 first article components, a Mean of the new product upgrade price of $4,060, and a Standard Deviation of $98 was estimated. Select the answer that best states the Practical Problem.

A.

If the average cost per component is $4,200 or less, then the purchase manager will introduce the new product upgrade with new components.

B.

If the average cost per component is greater than $4,200, then the purchase manager will introduce the new product upgrade with new components.

C.

Only if the average cost per product upgrade is $4,060, will the purchase manager introduce new product upgrades with new components.

D.

If the average cost per new product upgrade is less than $180, then the purchase manager will introduce the new product upgrade with new components.

Full Access
Question # 45

Which of these elements are not included in Implementation plans?

A.

Work breakdown structure

B.

Cost/Benefit ratios

C.

Risk management plans

D.

Planned audits of work completion

Full Access