Last Update 23 hours ago Total Questions : 465
The Graduate Management Admission Test (2022) content is now fully updated, with all current exam questions added 23 hours ago. Deciding to include GMAT practice exam questions in your study plan goes far beyond basic test preparation.
You'll find that our GMAT exam questions frequently feature detailed scenarios and practical problem-solving exercises that directly mirror industry challenges. Engaging with these GMAT sample sets allows you to effectively manage your time and pace yourself, giving you the ability to finish any Graduate Management Admission Test (2022) practice test comfortably within the allotted time.

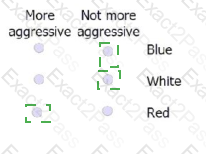
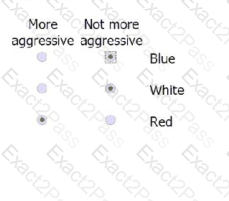
For each of the background colors, the graphic shows the average (arithmetic
mean) of the maximum prices that the participants who viewed the item with that
background reported that they were willing to pay for the item. Results are shown
for bath the auction and the negotiation scenarios.
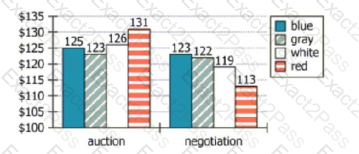
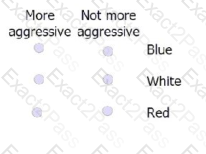
Assuming the researchers’ hypothesized link between offers and aggression is
correct, for each of the following background colors select More aggressive if, on
average, participants in the negotiation group in the study behaved more
aggressively when the product was displayed with that background color than the
participants did when the product was displayed with a gray background.
Otherwise, select Not more aggressive.
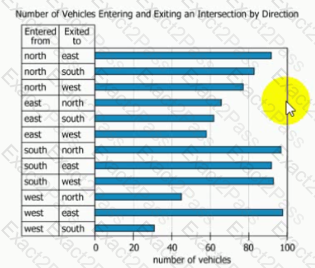
In order to better control traffic at a certain busy intersection, a study was conducted to determine how many vehicles passed through the intersection during various times of day and what trajectories they took. For each possible trajectory (combination of direction from which a vehicle entered the intersection and direction to which it exited the Intersection), the graph shows the number of vehicles passing through the intersection during a certain hour.

Welleby’s Plan
The water In the underground water table beneath the town of Welleby is moderately saline— 20,000millkjrarns of salt per liter of water (mg/L), or roughly half as saline as ocean water. To lower the level of the water table and thus prevent agricultural land from being inundated with salt water, the town plans to pump water from the table at a rate of 450kiloliters per day (kL/day) into a large shallow pond, allowing much of the water to evaporate. The town plans to divert 10percent of the water pumped from the water table to supplement Us supply of drinking water, which Is currently piped In from great distances. Due to the water ' s supply, the town intends to construct a desalination plant to treat the diverted water for use as drinking water.
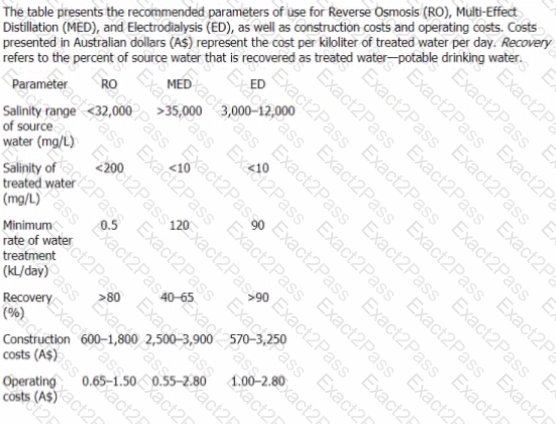
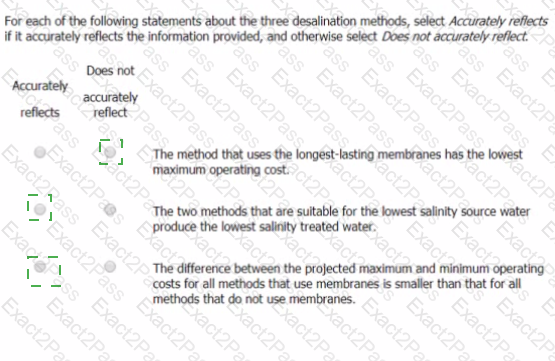
Desalination Types
Comparison
Welleby is deciding among the following three desalination methods.
Reverse Osmosis (RO): Water Is pushed through a membrane, leaving salts behind. RO systems can handle a large range of water flow rates and use relatively little energy. However, RO membranes are expensive and must be replaced every 2 to 5 years. There is also a possibility that bacteria can grow on the membrane. Introducing tastes and odors Into the desalinated water.
Multi-Effect Distillation (MED): Saline water Is heated to produce water vapor, from which Is condensed potable fresh water. This process requires large amounts of energy, regardless of the salinity of the source water. It becomes more cost effective as water volumes increase.
Electrodialysis (ED): Electricity is used to selectively move salts through a membrane. Consumption of energy Is directly proportional to the salinity of the water to be treated, so with higher salinities the process rapidly becomes more costly than other methods. ED membranes need to be replaced every 7 to 10years.
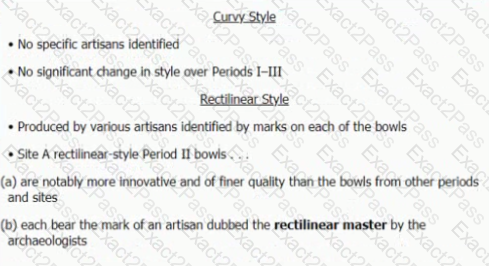
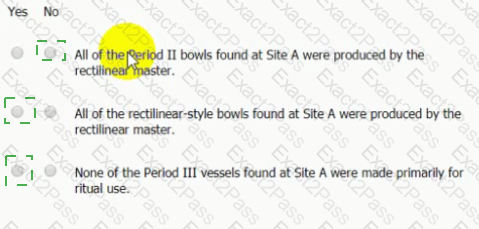
Archaeologists have excavated two ancient sites, Site A and Site B, each containing bowls and dishes. A third site containing similar vessels (bowls and dishes), Site C, Is known to have existed but has not yet been located. The vessels have been dated to three successive 40-vear-long time periods (Mil).
The dishes that were found are small and plain and were made primarily for everyday use. For each site, the average population at the site for a period is known to be roughly proportional to the number of dishes found that were dated to that period.
The bowls are more elaborate, decorated In either a curvy or a rectilinear style. They were made primarily for ritual use. The numbers of bowls found indicate the level of wealth of the site ' s inhabitants during the period to which the bowls were dated (with greater numbers indicating greater wealth).
Documents found at Sites A and B establish that exactly 18 of the dishes found at Site A were manufactured at Site C; otherwise, all of the vessels were made at the sites where they were found.
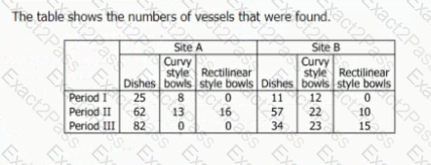
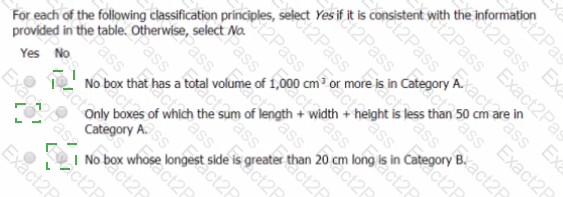
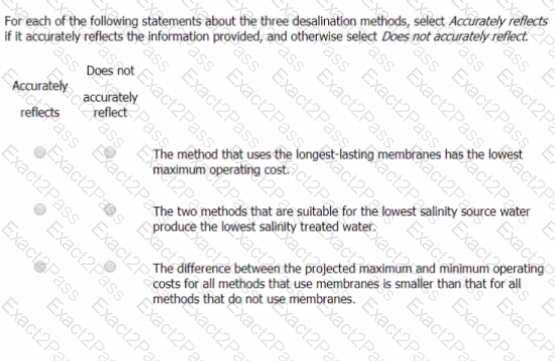
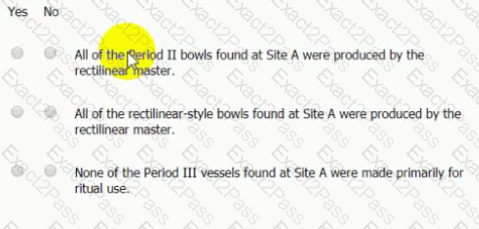
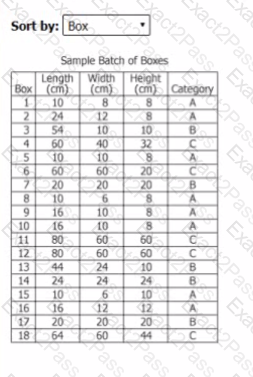
For each of the following statements, select Yes if the Information provided supports the statement. Otherwise, select No.
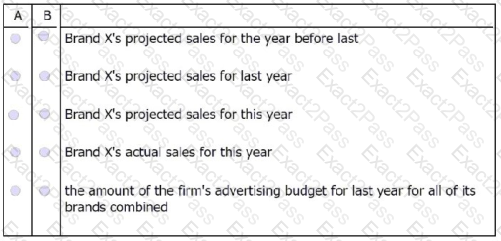
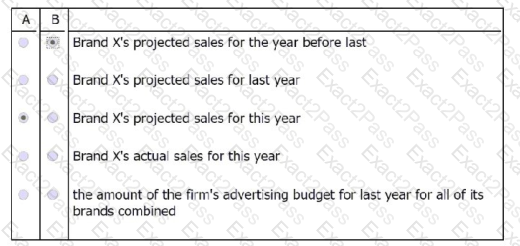
Executive: For this year, our firm ' s advertising budget for Brand X is four times that for last year, but only half that for the year before last. For each year, for each of our
brands, our advertising budget is 10 percent of the average (arithmetic mean) of two amounts: the brand ' s projected sales for the year and the brand ' s actual sales for the
preceding year. Actual sales of Brand X last year were $5.23 million.
Statement A: Given the executive ' s statements, a journalist could infer what this year ' s advertising budget for Brand X is if she knew what the amount of
was.
Statement B: Given the knowledge of this year ' s advertising budget for Brand X, if the reporter also knew Brand X ' s actual sales for the year before last, she could also
infer :
Select for A and for 8 two different options that, if inserted in the blanks, create statements that are supported by the statements attributed to the executive. Make only
two selections, one in each column.

Television picture quality improves as resolution increases. However, the resolution at which a given improvement in resolution becomes visible varies with the distance of
the viewer from the screen. As a viewer moves closer to the screen, a given improvement in resolution eventually becomes noticeable, finally conferring its “full benefit” at
a point at which moving closer would not improve the viewing experience.
On the graph, 480p, 720p, 1080p, and 1440p represent four common degrees of resolution: greater numbers indicate greater numbers of pixels on the screen and thus
greater resolution. Shaded portions show the distances at which these resolutions become noticeable, while the broken lines show the maximum distances at which a
viewer with normal eyesight would be expected to experience full benefit—all as a function of screen size. For each resolution and screen size shown, there is a small gap
between the maximum distance for full benefit from the resolution and the minimum distance for noticeable benefit from the next higher resolution.
(Note: 3 feet is roughly 1 meter, and 1 inch is roughly 2.5 centimeters.)
Assuming that the information contained in the graphic correctly applies to all viewers, select from the drop-down menus the options making the statements most
accurate.

Sales promotions can involve selling a product at a relatively low price or selling the product with a free (or seemingly free) unit of the product, as in " buy one, get one free " campaigns. Research shows that immediately following month-long sales promotions, a postpromotion dip may occur, i.e., sales for the following calendar month may be less than sales for the calendar month preceding the sales promotion.
To increase sales, Storex, a department store, held month-long sales campaigns to promote four of its products. A sales promotion was considered successful if unit sales of the product were at least 10% higher in each of the 2 calendar months immediately following the promotion than In the month preceding it.
Experts have offered explanations for postpromotion dip:
• Explanation I: Many consumers stockpile the product at relatively low cost during the sales promotion.
• Explanation II: " Buy one, get one free " promotions cause some consumers to undervalue the product, making them less likely to buy it following the sales promotion.
• Explanation HI: Many consumers who missed a " buy one, get one free " opportunity may, as a result, develop so-called inaction inertia, i.e., become less likely to buy the product at either the regular or even at a discount price than if the sales promotion had not occurred.
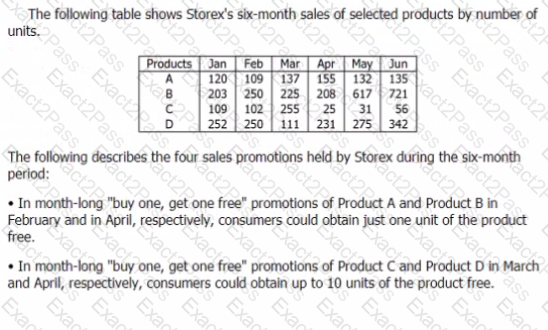
Which one of the following is most strongly supported by the sales data, given the other Information provided?
A certain small company has a policy that every manager must be scheduled to be present at the company ' s office at any time during which all of the manager ' s supervisees
are scheduled to be present at the office. The shifts of the three supervisees of a certain manager, in 24-hour format, are as follows:
* Employee 1—Scheduled to be present from 11:30 through 16:00 every business day
* Employee 2—Scheduled to be present from 9:00 through 14:30 every business day
* Employee 3—Scheduled to be present from 10:30 through 13:30 every business day
Indicate below the earliest time and the latest time at which, based on the information provided, the manager must be scheduled to be present at the office on every
business day. Make only two selections, one in each column.

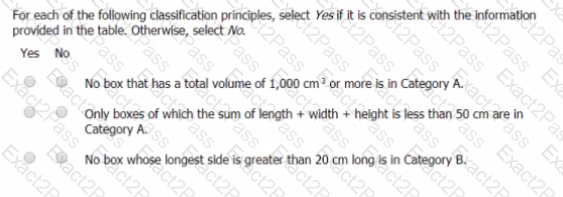
A company processes boxes that have a number of different dimensions. Based on the dimensions of the boxes, the company classifies all of them In three categories. A, B. and C. The table Ms some examples of boxes, their Dimensions, and their classification categories.


 Chart, scatter chart
Description automatically generated
Chart, scatter chart
Description automatically generated

 Graphical user interface, text, application, email
Description automatically generated
Graphical user interface, text, application, email
Description automatically generated
 Table
Description automatically generated
Table
Description automatically generated