Last Update 21 hours ago Total Questions : 50
The Qlik Sense Business Analyst Certification Exam - February 2021 Release content is now fully updated, with all current exam questions added 21 hours ago. Deciding to include QSBA2021 practice exam questions in your study plan goes far beyond basic test preparation.
You'll find that our QSBA2021 exam questions frequently feature detailed scenarios and practical problem-solving exercises that directly mirror industry challenges. Engaging with these QSBA2021 sample sets allows you to effectively manage your time and pace yourself, giving you the ability to finish any Qlik Sense Business Analyst Certification Exam - February 2021 Release practice test comfortably within the allotted time.
A business analyst needs to uniquely identify tour sheets in the app overview Custom images have been created for each sheet What should the business analyst do next?
A business analyst wants to create a dashboard for the Finance team to use The app must include four sheets one looking at the full dataset and three others focused on the regions APAC EMEA and AMERICAS each.
The team needs visualizations for
• Sales by Product in the past 6" months
• Cost of Sales on a map by Country
• Sales Cost and Margin by Month
Additionally the learn wants to dear fillers while navigating between sheets and enable chat in the hub Which features should be used?
A business analyst has access to all of a company's data tor the past 10 years The source table consists of the following fields Transactions Transaction Time Transaction Date Transaction Year Cardholder Cardholder address Cardissuer and Amount Users request to create an app based on this source
Users only review me data for the past 2 years Data must be updated daily Users do not view cardholder into
What should the business analyst do to reprove the app performance?
A company installs Qlik Sense on Windows without any additional visualization bungles A business analyst must create an app with three sheets
• Sheet 1 KPIs and sales trends for the past 12 months
• Sheet 2 Regional sales by representative
• Sheet 3 Sales by country displayed in a map
Users must be able to view all of the sheets and make selections for their analyses.
Which three objects should be added to the three sheets? (Select three)
A company CEO requests a dashboard that easily displays provides understating and tracks company performance. There are several ma n dashboard requirements:
• Viewable by a mobile device
• Display multiple key measures
• Provide ability to easily navigate to other sheets
Which feature meets these requirements?
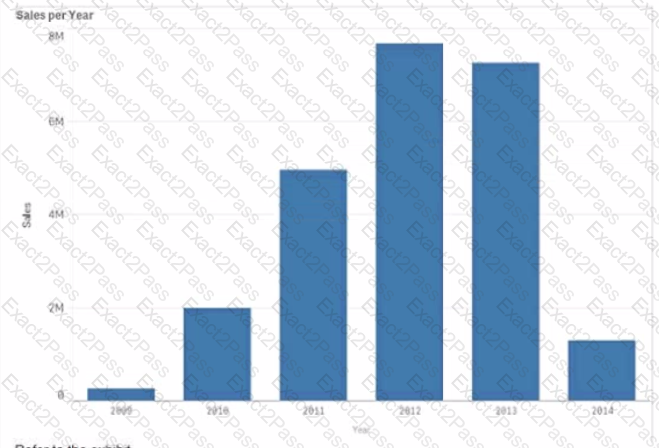
Refer to the exhibit.
A business analyst needs to display a bat chart only when less than 100 customers are selected
What should the business analyst create to meet this requirement
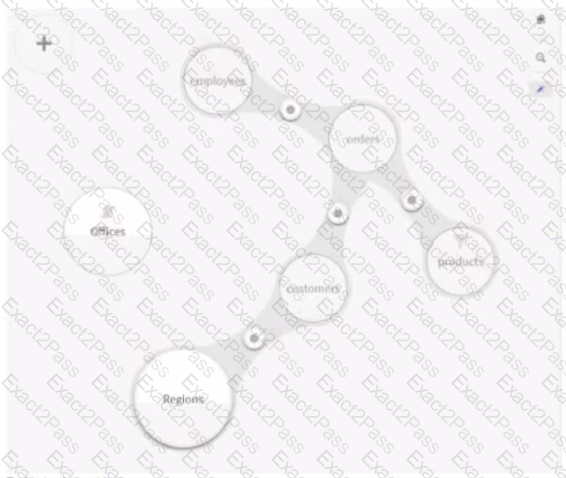
Refer of the exhibit.
A business analyst needs to add a table and make sure it is associated appropriately. The table contains regional information about employee offices and must be able to titer the orders by employee office.
Which steps should the business analyst take?
A Help Desk department sets a first-time fix target of 65% for ail customer calls. The department has a measure that captures the actual first-time fix percentage. A business analyst needs to choose the visualization that most effectively shows the performance against the target using a color gradient Which visualization should the business analyst use?
A business analyst is creating an app for the sales department
Users of the app most be able to create sheets and analyze data The sales department has several additional requirements
• Reuse the global sales visualization
• Create new visualizations
• The app has over 100 visualizations
Users will NOT have access to the full data model
What should be added to the master items to meet the requirement?
A company CEO requests an app that contains global sales information. The CEO needs to present this information to an audience of international investors during an upcoming meeting
The presentation must meet several requirements
• Contain visualizations that present dearly to a large audience
• Answer audience questions dynamically
• Be made available as shared content
• Emphasize important sales revenue
Which Qlik Sense features must the business analyst prepare?

