Last Update 13 hours ago Total Questions : 317
The Tableau Desktop Specialist content is now fully updated, with all current exam questions added 13 hours ago. Deciding to include TDS-C01 practice exam questions in your study plan goes far beyond basic test preparation.
You'll find that our TDS-C01 exam questions frequently feature detailed scenarios and practical problem-solving exercises that directly mirror industry challenges. Engaging with these TDS-C01 sample sets allows you to effectively manage your time and pace yourself, giving you the ability to finish any Tableau Desktop Specialist practice test comfortably within the allotted time.
You can create _______________ for members in a dimension so that their labels appear differently in the view.
Which of the following returns the Absolute Value of a given number?
What are two methods for renaming a field in a visualization? Choose two.
How can you MANUALLY assign geographic roles to a dimension from the data pane?
Which of the following are valid Dashboard size options?
Which of the following are compelling reasons to use a Stacked Bar Chart?
Which of the following are valid way(s) to make either of Rows or Columns Bold without affecting the other?
What is the minimum amount of RAM recommended for any production use of Tableau Server?
Larger image
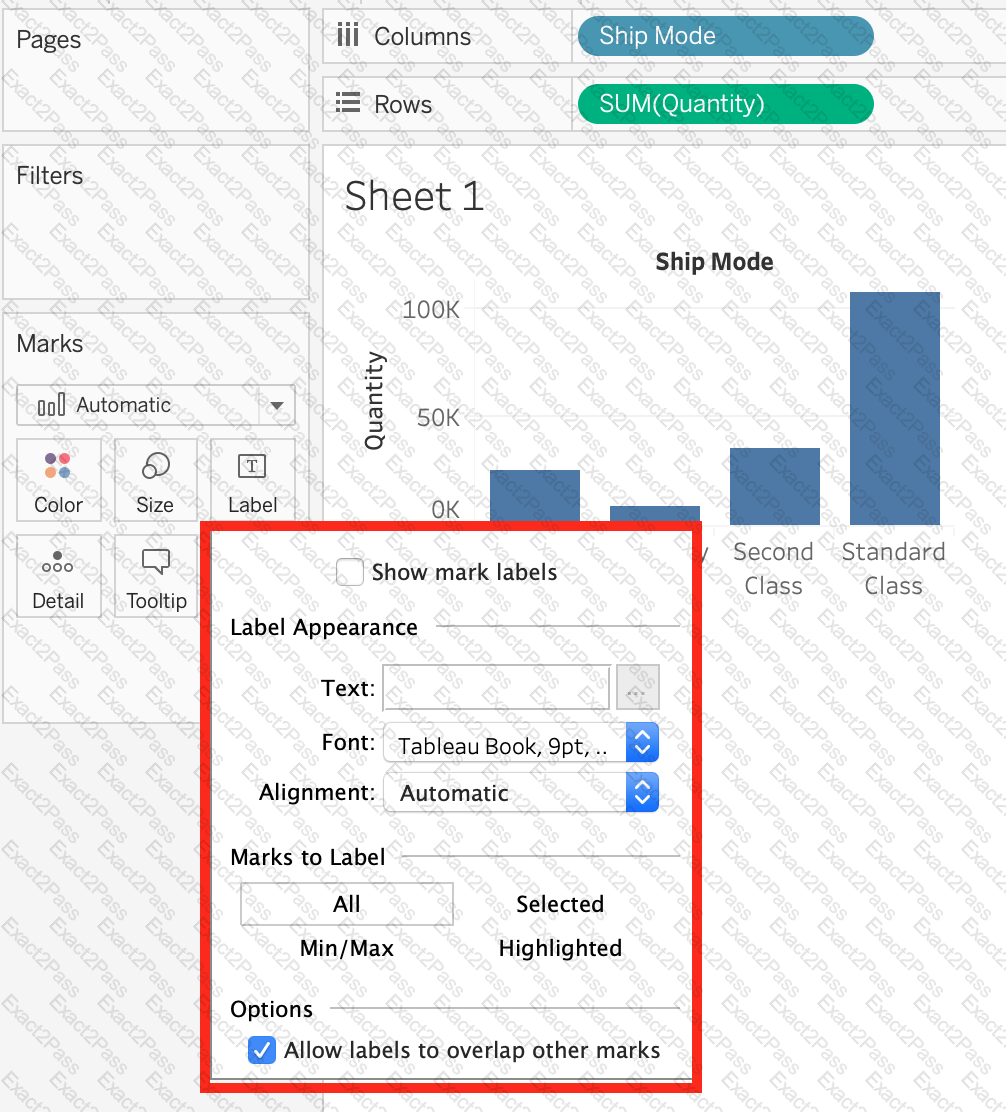
What is this view referred to as in Tableau?
Using the dataset, create a bar chart showing the average Quantity broken down by Region, and filtered by Country to only show Japan. What was the average Quantity in the State of Tokyo?