Last Update 8 hours ago Total Questions : 175
The Tableau Certified Data Analyst Exam content is now fully updated, with all current exam questions added 8 hours ago. Deciding to include TDA-C01 practice exam questions in your study plan goes far beyond basic test preparation.
You'll find that our TDA-C01 exam questions frequently feature detailed scenarios and practical problem-solving exercises that directly mirror industry challenges. Engaging with these TDA-C01 sample sets allows you to effectively manage your time and pace yourself, giving you the ability to finish any Tableau Certified Data Analyst Exam practice test comfortably within the allotted time.
You have the following dataset that contain null values in the Profits field.
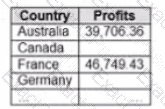
You want the data to appear as shown in the following table.
Which two formulas achieve the goal? Choose two.
You have the following data source in tableau Server.
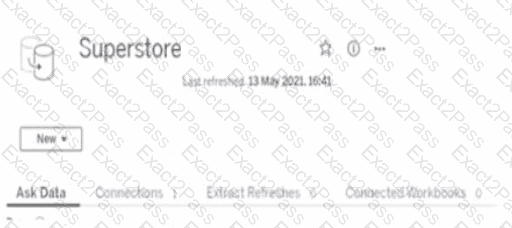
You need to ensure that the data is updated every hour.
What should you select?
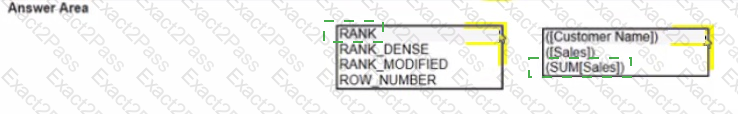
You have the following dataset.
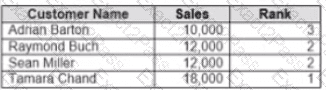
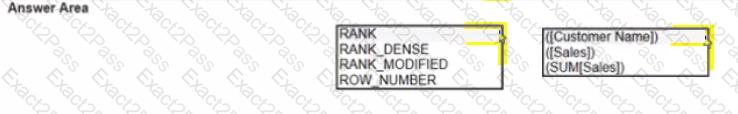
Yon need to calculate the ranking shown in the Rank field.
How should you complete the formula? (Use the dropdowns in the Answer Area to select the correct options to complete the formula ?
You have a dashboard that contains confidential information about patients health. The data needs to always be up to date tor a team of healthcare workers How should you share me dashboard with the healthcare workers?
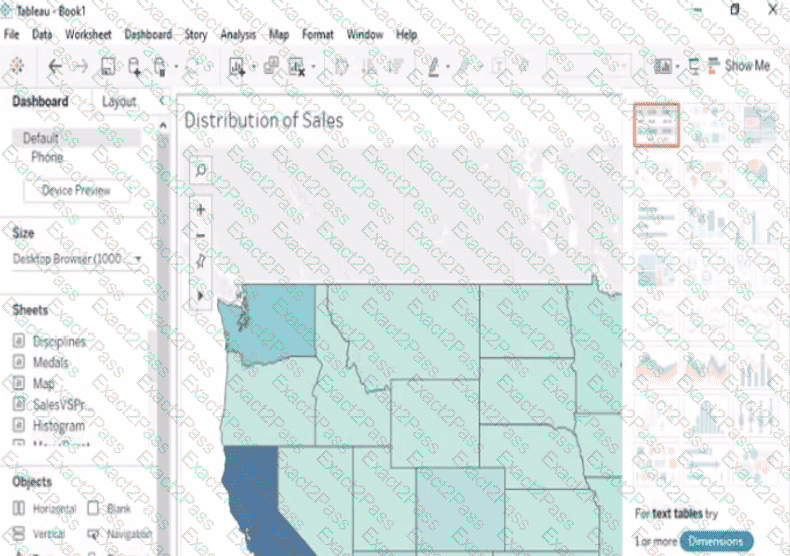
You have the following dashboard that contains two visualizations.
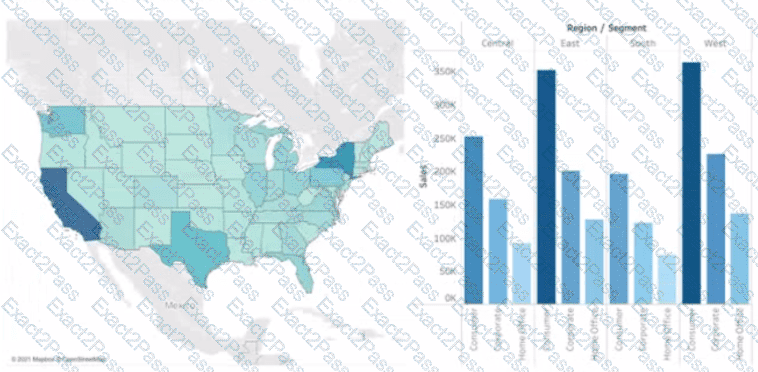
You want to show only one visualization at time. Users must be able to switch between visualizations.
What should you me?
You have a line chart on a worksheet.
You want to add a comment to March 2020 as shown in the following visualization.
What should you do?
Open the link to Book1 found on the desktop. Open SalesVSProfit worksheet.
Add a distribution band on Profit to show the standard deviation from- 1 to 1.
Open the link to Book1 found on the desktop. Open the Histogram worksheet and use the Superstone data source.
Create a histogram on the Quantity field by using bin size of 3.
Open the link to Book1 found on the desktop. Open the Line worksheet.
Modify the chart to show only main and max values of both measures in each region.
Open the link to Book1 found on the desktop. Use the Superstore data source.
Split the Customer Name field into two fields named First Name and Last Name.