Last Update 8 hours ago Total Questions : 50
The Adobe Analytics Business Practitioner Expert content is now fully updated, with all current exam questions added 8 hours ago. Deciding to include AD0-E208 practice exam questions in your study plan goes far beyond basic test preparation.
You'll find that our AD0-E208 exam questions frequently feature detailed scenarios and practical problem-solving exercises that directly mirror industry challenges. Engaging with these AD0-E208 sample sets allows you to effectively manage your time and pace yourself, giving you the ability to finish any Adobe Analytics Business Practitioner Expert practice test comfortably within the allotted time.
A stakeholder wishes to build a Freeform Table in Analysis Workspace that consists of a list of specific pages on the company website and the number of visits to them.
They are not able to find a page dimension item for an existing page that they are looking for.
What would be recommended?
A bank client wants to understand usage of their mobile website by geographical region. The analytics team is tasked with creating segments to provide this data.
Why would the analytics team decide to use segment stacking in the Segment Builder?
Refer to the exhibit.
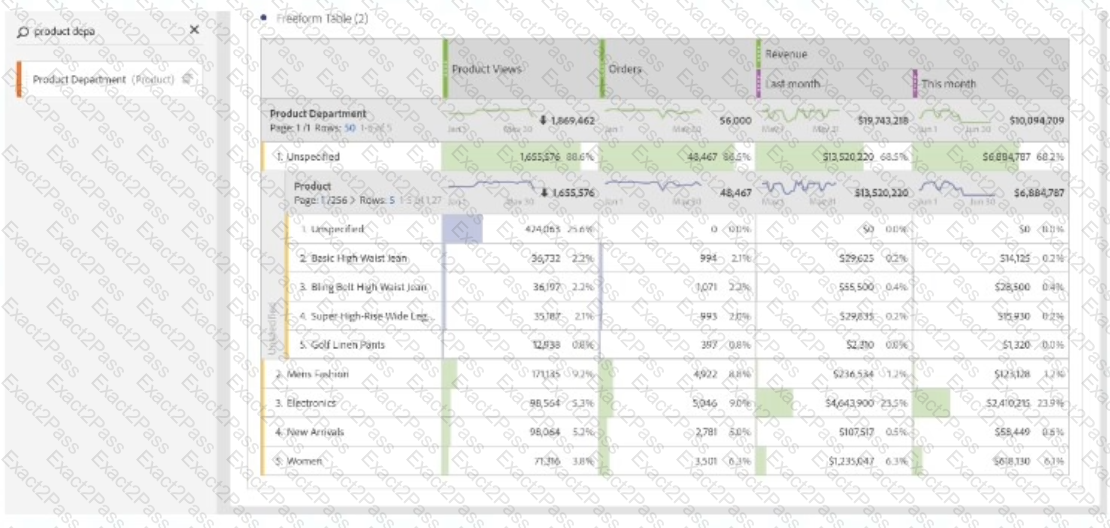
Analyzing results from multinational e-commerce, a data analyst realizes much of the product view results and orders are being mapped to an "Unspecified" department name.
What is the probable cause?
The Chief Marketing Officer has established a monthly revenue target for an online store and wants to see how revenue for the current month is tracking towards that goal.
Which Visualization should be used for this report?
What column options can an analyst choose to manage data feeds?
A curator clicks on a tile inside a Mobile Scorecard with no dimension applied to the tile. Which Dimensions will be displayed as the breakdown Dimension?
Which is a benefit of using a Virtual Report Suite?
The Solution Design Reference (SDR) document states that the expiration setting for eVarl 1 is "never" and the allocation is Most Recent (Last).
What happens to the persisted value when there is a new value collected for eVar11?
An analyst is co-creating a report with their client counterpart in preparation for a running marketing performance dashboard. Marketing is still getting onboarded with the analytics tool and hope to begin leveraging data to enable data-driven decisions.
How would the analyst look to share out the dashboard broadly across the team?
An analyst is given a list of specific events a user must take to complete a purchase. What would be used to see the conversion rate between steps?

