Exact2Pass

Last Update 11 hours ago Total Questions : 357
The Certified Lean Six Sigma Black Belt (CLSSBB) content is now fully updated, with all current exam questions added 11 hours ago. Deciding to include CLSSBB practice exam questions in your study plan goes far beyond basic test preparation.
You'll find that our CLSSBB exam questions frequently feature detailed scenarios and practical problem-solving exercises that directly mirror industry challenges. Engaging with these CLSSBB sample sets allows you to effectively manage your time and pace yourself, giving you the ability to finish any Certified Lean Six Sigma Black Belt (CLSSBB) practice test comfortably within the allotted time.

This is an example of part of a:
SCENARIO
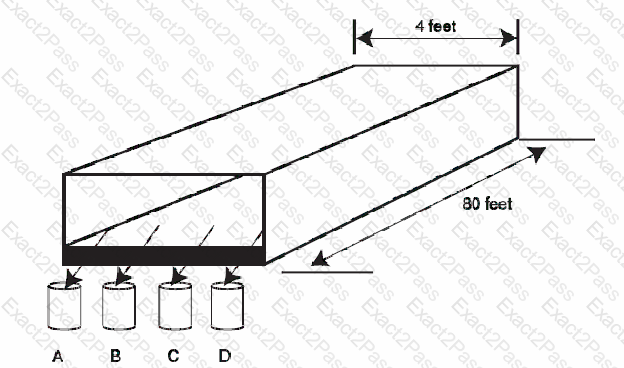
A Six Sigma team is measuring the moisture content of corn starch as it leaves the conveyer belt of a dryer. They collect one sample four cups of starch at times indicated in the chart at fixed locations labeled A, B, C, and D across the end of the belt. See the diagram below.
After some more work on the dryer, additional data are collected which when plotted looks like this:
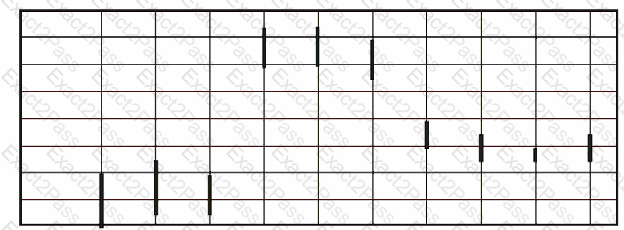
Which type of variation dominates?
A sample of size 50 from machine A has a mean of 18.2 and standard deviation 3.1. A sample of size 40 from machine B has mean 17.6 and standard deviation 2.8. Do these data indicate that the population for machine A has a larger mean? Assume the populations are normal.
In problem 1, do the data indicate that the population for machine A has a larger standard deviation?
The Toronto plant produces appliances in the following distribution: Type A 23% Type B 42% Type C 35% A random sample of 300 appliances from the Texas plant has the following distribution: Type A 73 Type B 111 Type C 116 Is the distribution of appliances at the Texas plant the same as that at the Toronto plant?
A team wants a technique for doing an initial study of a process that not every team member is familiar with. They should use:
There are 14 different defects that can occur on a completed time card. The payroll department collects 328 cards and finds a total of 87 defects. DPU =
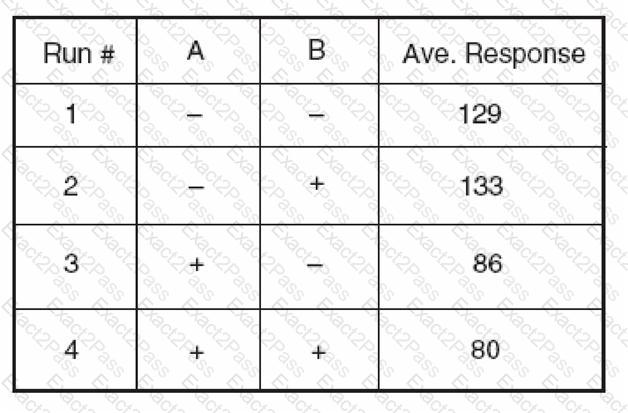
Calculate the main effect of factor A (i. e. A+ – A– ).
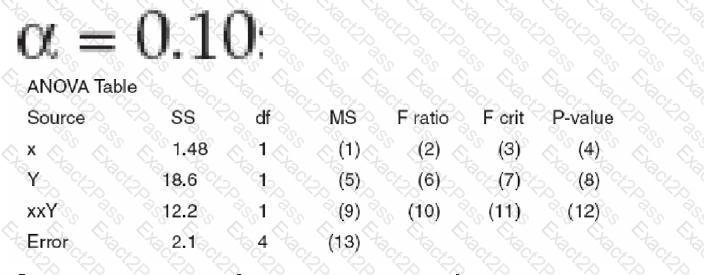
Find the value of (6) in the ANOVA table. Assume:
According to the Central Limit Theorem: