Exact2Pass

Last Update 11 hours ago Total Questions : 357
The Certified Lean Six Sigma Black Belt (CLSSBB) content is now fully updated, with all current exam questions added 11 hours ago. Deciding to include CLSSBB practice exam questions in your study plan goes far beyond basic test preparation.
You'll find that our CLSSBB exam questions frequently feature detailed scenarios and practical problem-solving exercises that directly mirror industry challenges. Engaging with these CLSSBB sample sets allows you to effectively manage your time and pace yourself, giving you the ability to finish any Certified Lean Six Sigma Black Belt (CLSSBB) practice test comfortably within the allotted time.
A population of size 1,000,000 has mean 42 and standard deviation 6. Sixty random samples, each of size 15 are selected. According to the Central Limit Theorem the distribution of the sixty sample means has a standard deviation of approximately:
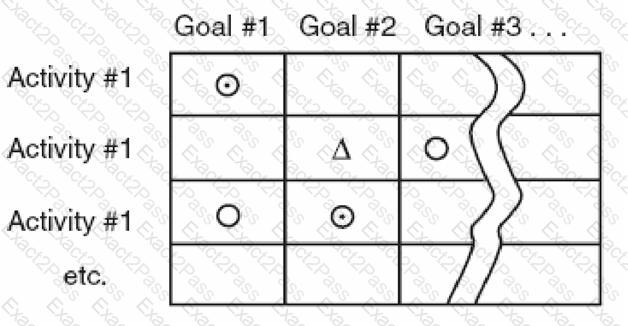
A management team lists nine goals across the top of a rectangle and 15 activity initiatives along the left hand side of the rectangle. If one of the activities strongly supports one of the goals a circle is placed in the box where that activity’s row intersects the goal’s column. If the activity’s support is very strong a “bulls eye” is placed in the box and if the support is weak a triangle is used.
This best describes which problem solving tool?
Find the value of (3) in the ANOVA table. Assume:

A team is investigating ways to reduce power outages. They determine that an outage can occur in only three ways: grid failure, local transformer failure or local overload. They then investigate each of these three events for possible causes, etc. They draw a diagram that “fans out” using the power outage as the handle of the fan.
These improvements are best described by which approach to problem solving?
Find the value of (5) in the ANOVA table. Assume:

If the probability that event A occurs is 0.51, the probability that event B occurs is 0.64 and that probability that both A and B occur is 0.23 then:
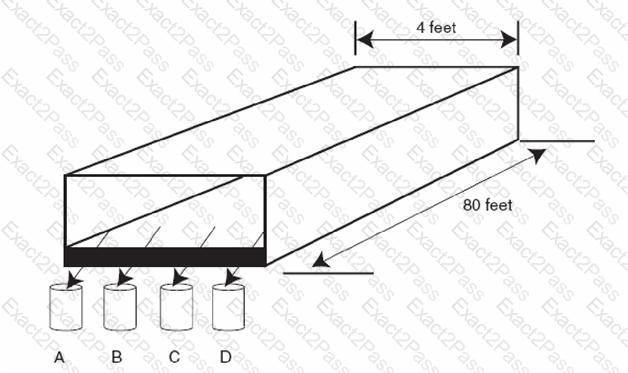
SCENARIO A Six Sigma team is measuring the moisture content of corn starch as it leaves the conveyer belt of a dryer. They collect one sample four cups of starch at times indicated in the chart at fixed locations labeled A, B, C, and D across the end of the belt. See the diagram below.
Find the sample linear correlation coefficient and the sample coefficient of determination for the data in problem VI.11.
Customer segmentation refers to:
The team in the above problem draws arrows from Post-It® notes that are causes to notes that are the effects of these causes. This step is best described by which approach to problem solving?
SWOT is an acronym for: