Summer Sale Special Limited Time 70% Discount Offer - Ends in 0d 00h 00m 00s - Coupon code: buysanta

Exact2Pass Menu

Cisco AppDynamics Associate Performance Analyst (CAAPA)

Last Update 5 hours ago Total Questions : 124

The Cisco AppDynamics Associate Performance Analyst (CAAPA) content is now fully updated, with all current exam questions added 5 hours ago. Deciding to include 500-420 practice exam questions in your study plan goes far beyond basic test preparation.

You'll find that our 500-420 exam questions frequently feature detailed scenarios and practical problem-solving exercises that directly mirror industry challenges. Engaging with these 500-420 sample sets allows you to effectively manage your time and pace yourself, giving you the ability to finish any Cisco AppDynamics Associate Performance Analyst (CAAPA) practice test comfortably within the allotted time.

Question # 21

Which two tabs in the Transaction Snapshot window point the developer to a class, method, and line number in the code? (Choose two.)

A.

More

B.

Data Collectors

C.

DB and Remote Services Calls

D.

Call Graph

E.

Slow Calls & Errors > Hot Spots

F.

Servers

Question # 22

A Performance Analyst has noticed a significant decrease in an application ' s workload, measured in calls per minute, and is trying to identify the root cause. Which option will give the Performance Analyst insight into the behavior of the affected Business Transactions?

A.

Review Top Business Transactions by Load in the Application Dashboard

B.

Review all elements in the Application Flow Map and identify variations in load

C.

In Metric Browser, plot Calls/min for the Application

D.

Review Business Transactions and enable Show Trends

E.

Review the Transaction Score for the Application

Question # 23

An online order portal for a restaurant has a “menu” transaction with different request types that must be monitored as separate transactions, such as “menu.salads” and “menu.entree.” A Performance Analyst wants to create one rule that separates the transactions instead of creating an individual rule for each request type. Which option should be enabled on a Custom Match rule?

A.

HTTP Request Data Collector

B.

Method Invocation Data Collector

C.

Split Transaction using JSON

D.

Split Transaction using request data

Question # 24

What does the Live Preview option in a Business Transaction Discovery Session allow a user to do?

A.

See if new Transaction Discovery Rules work

B.

Provide streaming logs from the application agent

C.

Search classes and methods currently running on the system

D.

Stream entry points in your application

Question # 25

Which path is used to specify a metric that evaluates across multiple hardware entities or memory pools?

A.

Absolute metric path with a wildcard

B.

Wildcards are not available in the Metric Browser

C.

Relative metric path with a wildcard

D.

Relative and absolute paths cannot be used with a wildcard

Question # 26

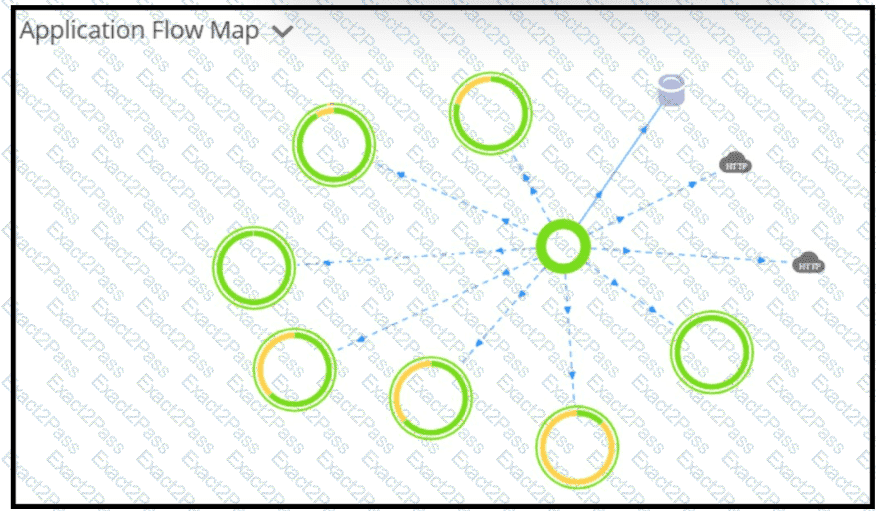
Refer to the exhibit.

The application flow map shows several downstream applications in yellow, while the flow lines are blue and activity within the current application appears normal. Because the tier depends on these downstream applications, how could a Performance Analyst quickly evaluate the map against previous performance?

A.

Use the function Compare Against Baseline

B.

Use Correlation Analysis

C.

Open and review the Health Rule Violations

D.

View the Metric Browser Baselines

Question # 27

A Performance Analyst received an alert that the Average Response Time is increasing after a new marketing offer was released. Which metric would quickly help the Performance Analyst determine that users may not be critically impacted?

A.

Errors per Minute increase

B.

Calls per Minute decrease

C.

Errors per Minute decrease

D.

Calls per Minute increase

Question # 28

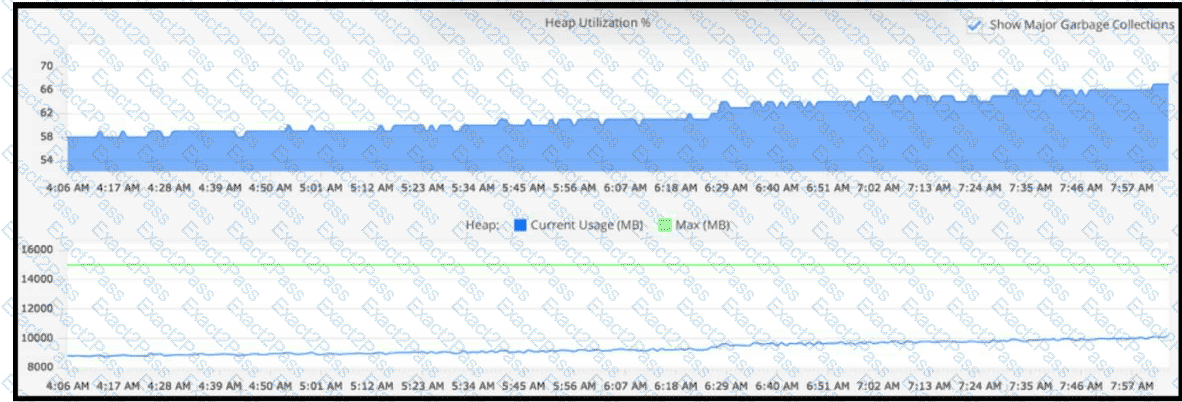
Refer to the exhibit.

Using this heap-utilization graph, which method is used to confirm whether a memory leak is occurring during a specific timeframe?

A.

In Metric Browser, navigate through Application Infrastructure > Hardware Resources and select Memory Total (MB) and Used (MB)

B.

In Tiers and Nodes, open the JMX tab and select JVM > Memory > Heap > Max Available (MB) and Current Usage (MB)

C.

In Metric Browser, navigate through Application Infrastructure > Hardware Resources and select Memory Total (MB) and Swap Used (MB)

D.

In Tiers and Nodes, open the Memory tab and visualize Heap Utilization (%) and Heap Current Usage (MB) versus Max (MB)

Question # 29

In which two cases does AppDynamics start transaction snapshots? (Choose two.)

A.

AppDynamics determines the user experience for the Business Transaction to be slow, or the transaction incurred an error.

B.

AppDynamics collects snapshots when there is a surge in the Calls per Minute metric.

C.

AppDynamics collects snapshots during periodic snapshot collection.

D.

AppDynamics collects snapshots during an asynchronous session.

Question # 30

A development team responsible for the front-end shopping application has asked to receive an email every time the Java container thread count exceeds 25. Which alert and response capabilities settings will provide the email?

A.

Node Health - JMX Thread Pools ( > Specific Value) + Notification Action (Send an Email)

B.

Node Health - Thread Pools ( > Specific Value) + Notification Action (Send an Email)

C.

Node Health - Thread Pools ( > Specific Value) + Notification Action (Custom Action)

D.

Node Health - JMX Thread Pools ( > Baseline) + Notification Action (Send an Email)

Go to page: