Exact2Pass

Last Update 23 hours ago Total Questions : 314
The Tableau Desktop Specialist Exam content is now fully updated, with all current exam questions added 23 hours ago. Deciding to include Desktop-Specialist practice exam questions in your study plan goes far beyond basic test preparation.
You'll find that our Desktop-Specialist exam questions frequently feature detailed scenarios and practical problem-solving exercises that directly mirror industry challenges. Engaging with these Desktop-Specialist sample sets allows you to effectively manage your time and pace yourself, giving you the ability to finish any Tableau Desktop Specialist Exam practice test comfortably within the allotted time.
You create a crosstab that shows a list of 100 hotel chains alongside their average nightly cost. You also create two groups showing, respectively, the top 10 and bottom 10 hotel chains by cost, with subtotals.
What should you do to improve the crosstab and compare the two groups to all the remaining hotel chains?
You want to update the font of an entire workbook.
What should you use to configure the default fonts?
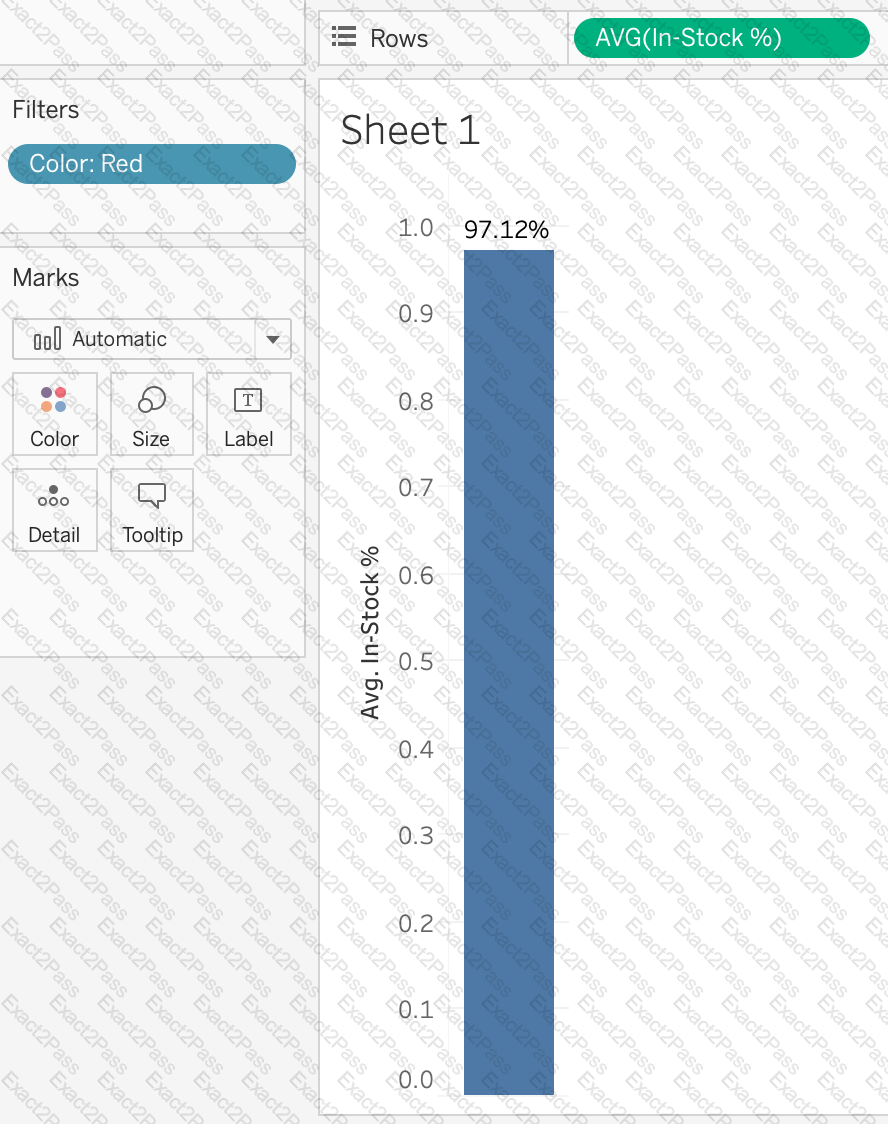
Using the Geo Data table, create a Bar chart showing the In-Stock percentage for each Color. What is the Average In-Stock percentage for the Color Red? Present your answer correctly upto 2 decimal places.
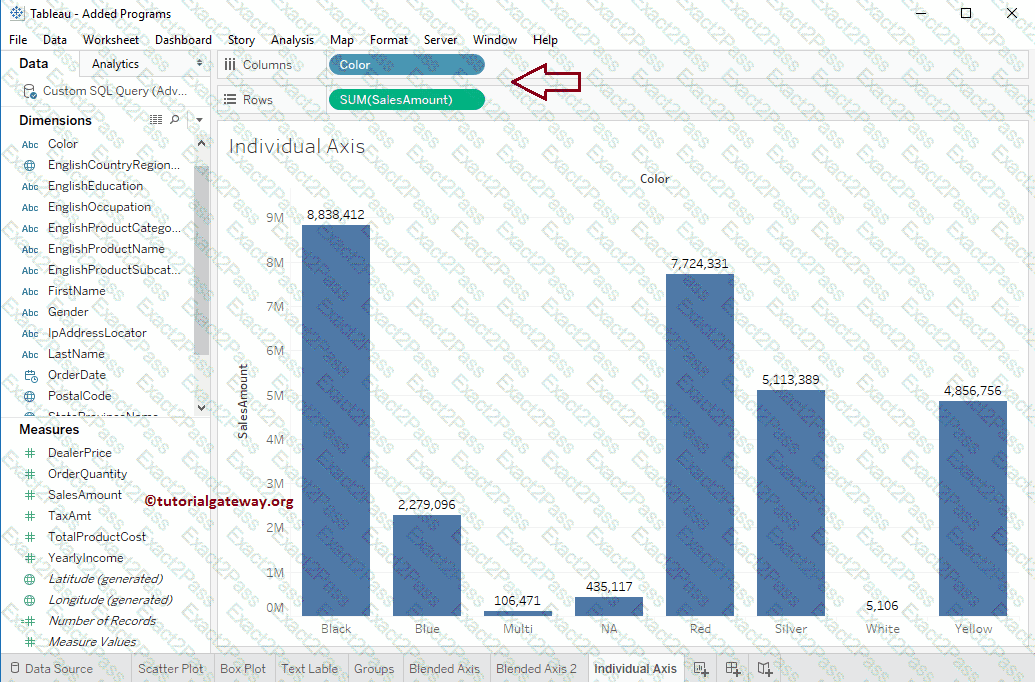
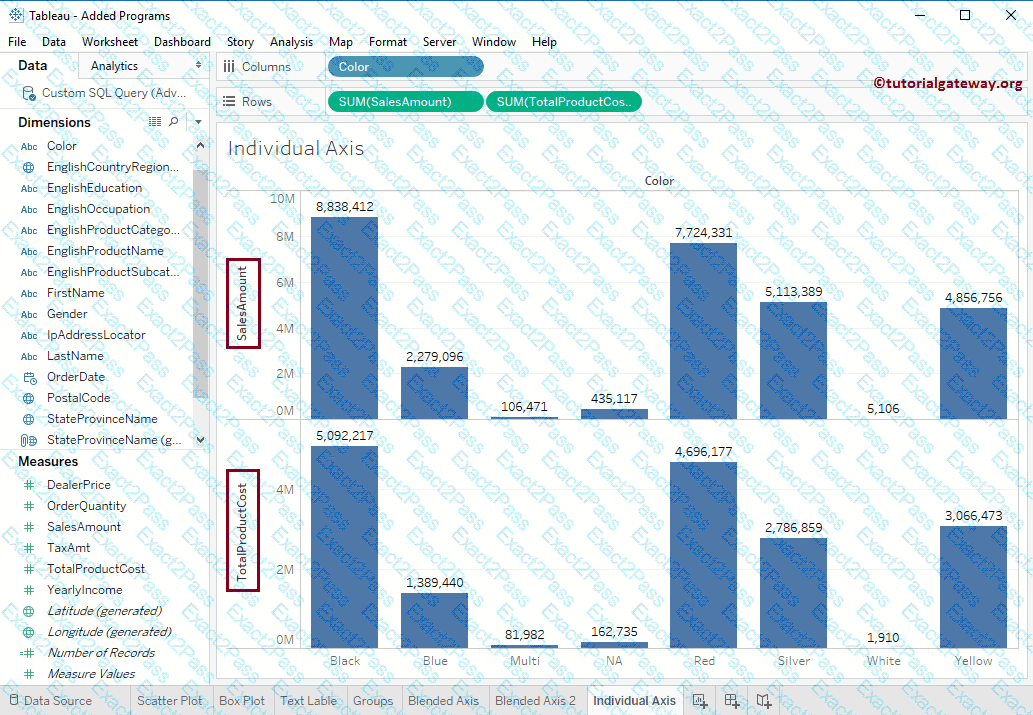
You have a bar chart that has a dimension on the Columns shelf and a measure on the Rows shelf.
How can you make a stacked bar chart?
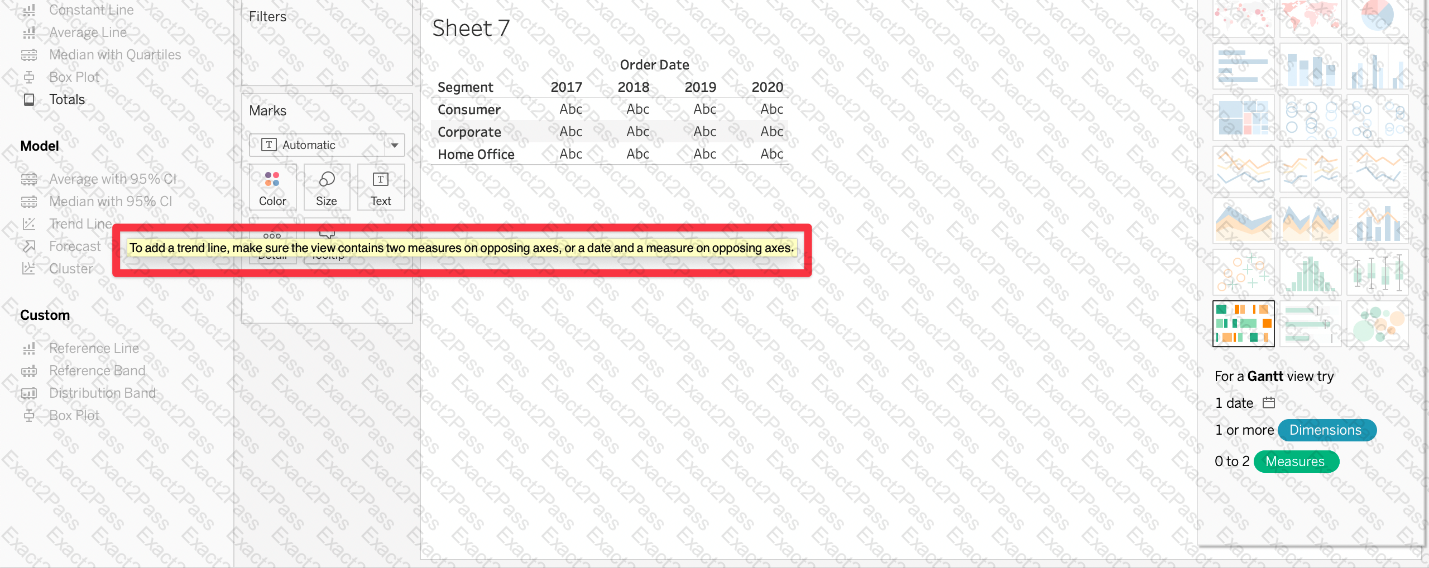
Which of the following are required to create a trend line?
What are two examples of a date value?
Choose two.
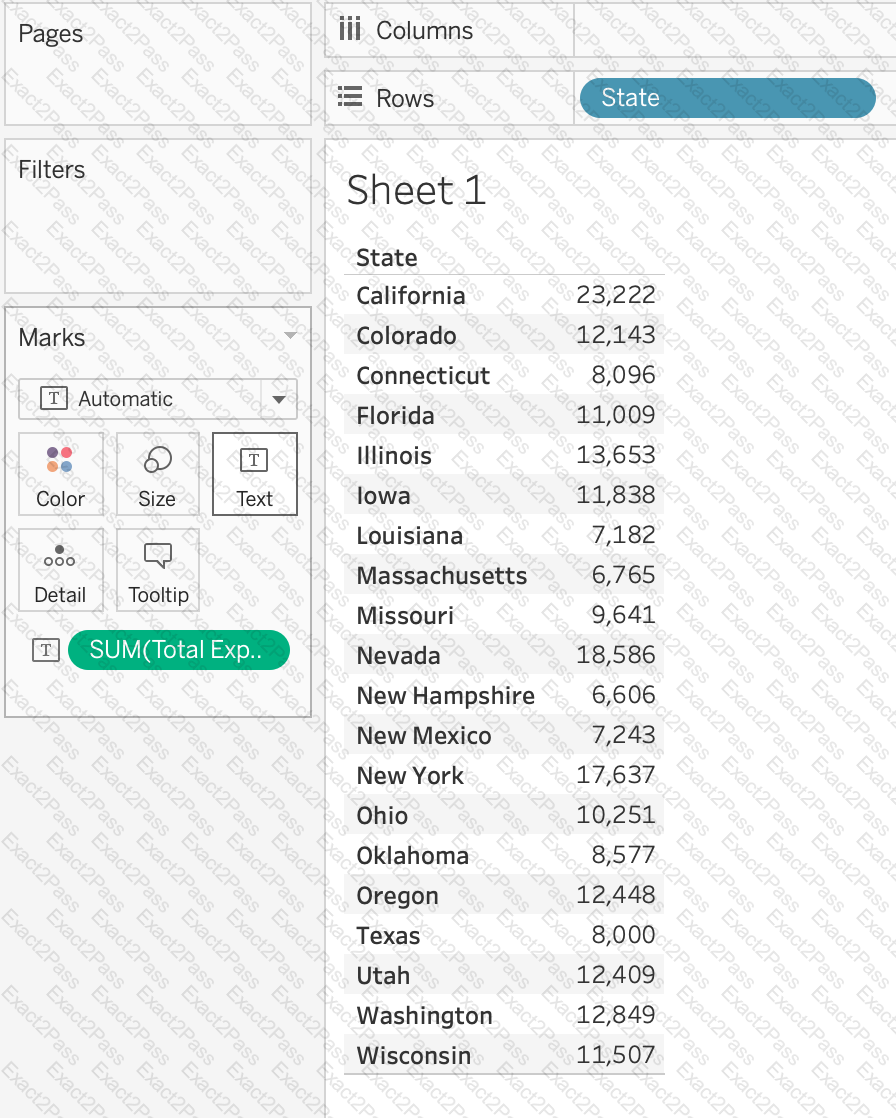
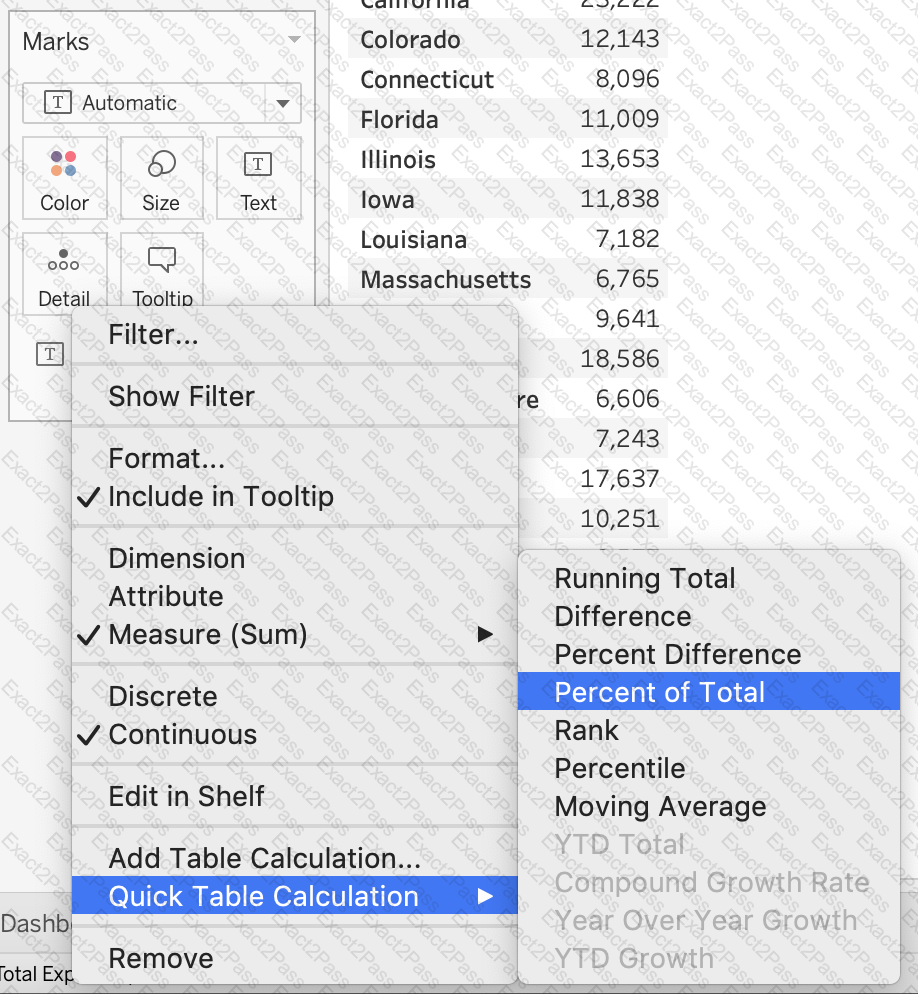
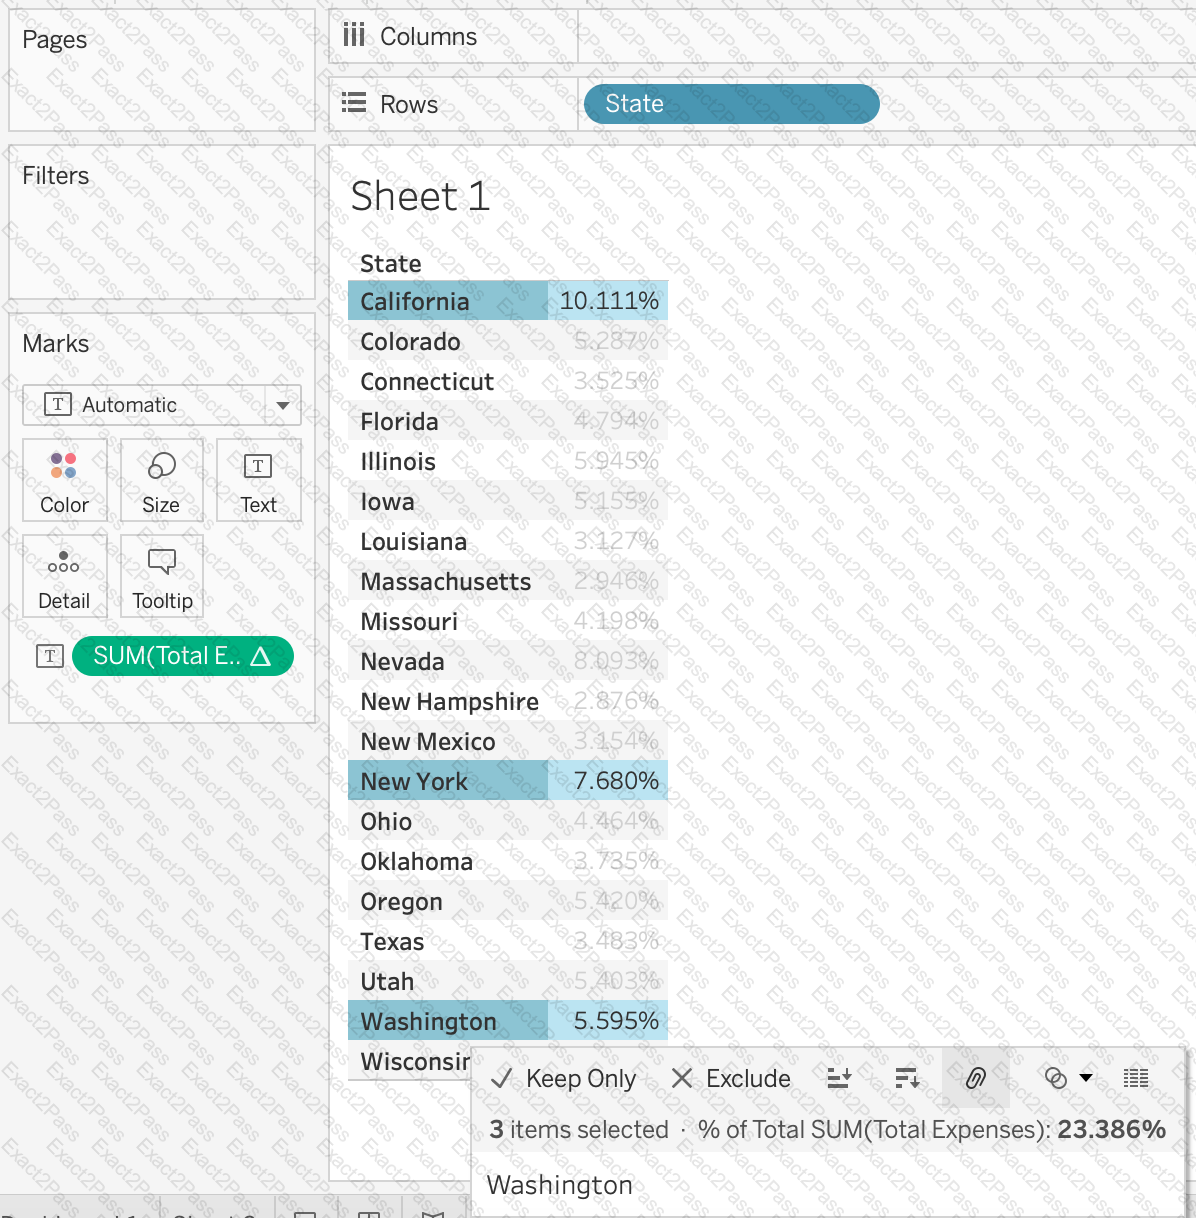
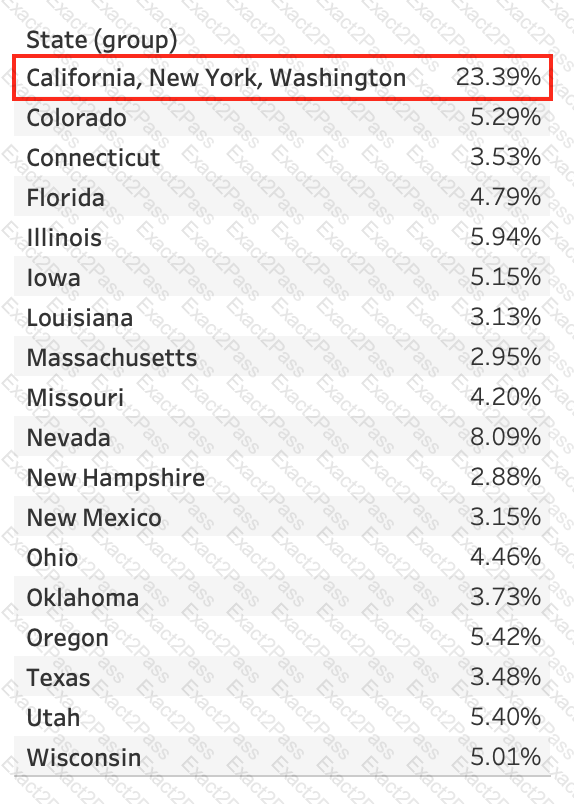
Using the CoffeeChain table, create a crosstab showing the Total Expenses per State and add Column Grand Totals to the view. Now group the states of New York, California and Washington. What percent of the total sales does this group contribute?
When is an axis created for the visualisation in Tableau?
To display data that has both negative and positive quantitative values, Tableau Desktop will display marks by using__________________as the default.
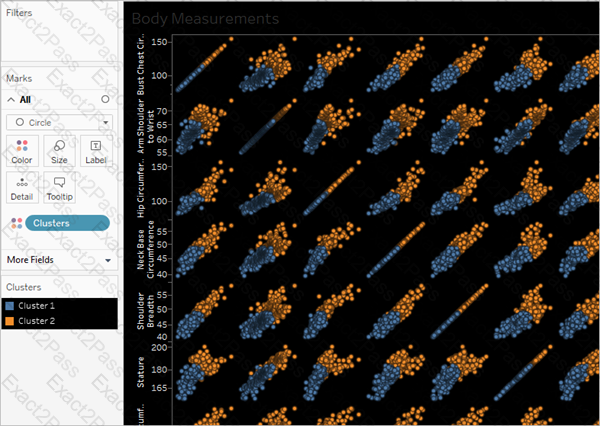
__________ is a technique in Tableau which will identify marks with similar characteristics

 Graphical user interface, application
Description automatically generated
Graphical user interface, application
Description automatically generated