Exact2Pass

Last Update 15 hours ago Total Questions : 314
The Tableau Desktop Specialist Exam content is now fully updated, with all current exam questions added 15 hours ago. Deciding to include Desktop-Specialist practice exam questions in your study plan goes far beyond basic test preparation.
You'll find that our Desktop-Specialist exam questions frequently feature detailed scenarios and practical problem-solving exercises that directly mirror industry challenges. Engaging with these Desktop-Specialist sample sets allows you to effectively manage your time and pace yourself, giving you the ability to finish any Tableau Desktop Specialist Exam practice test comfortably within the allotted time.
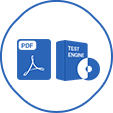
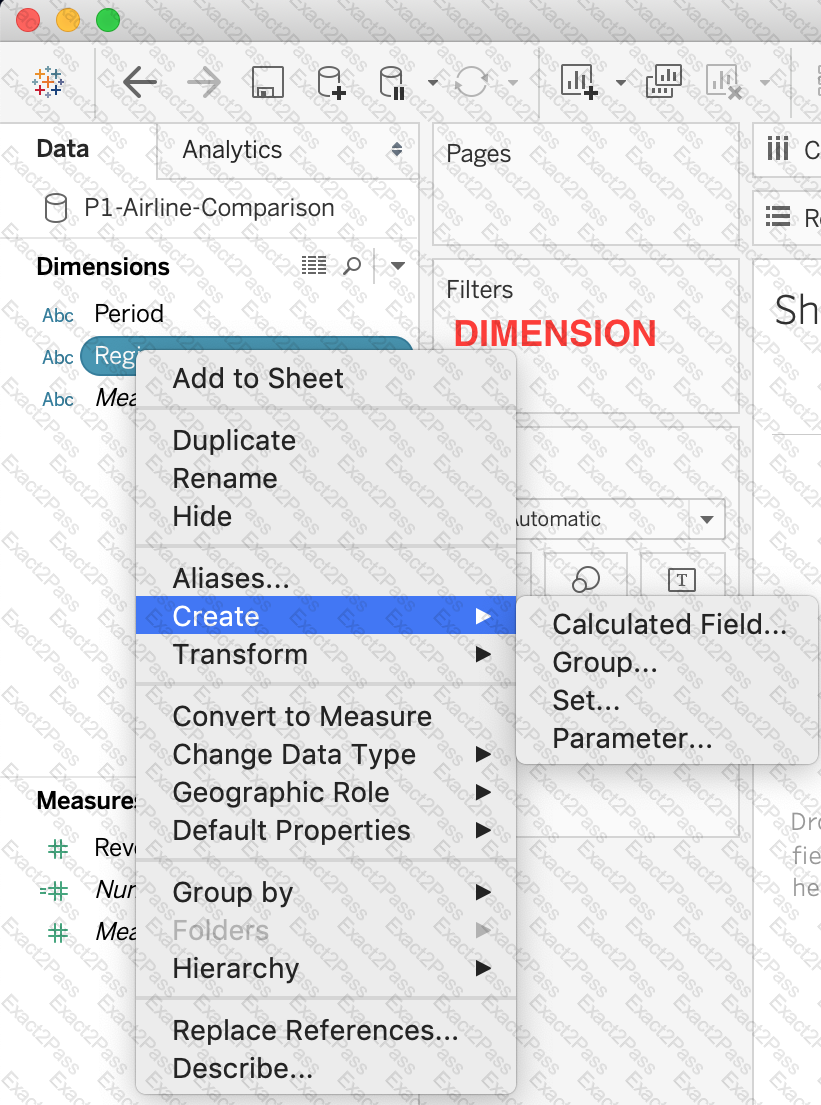
True or False: Sets can be created on Measures
What are two requirements to combine two tables by using a union? Choose two.
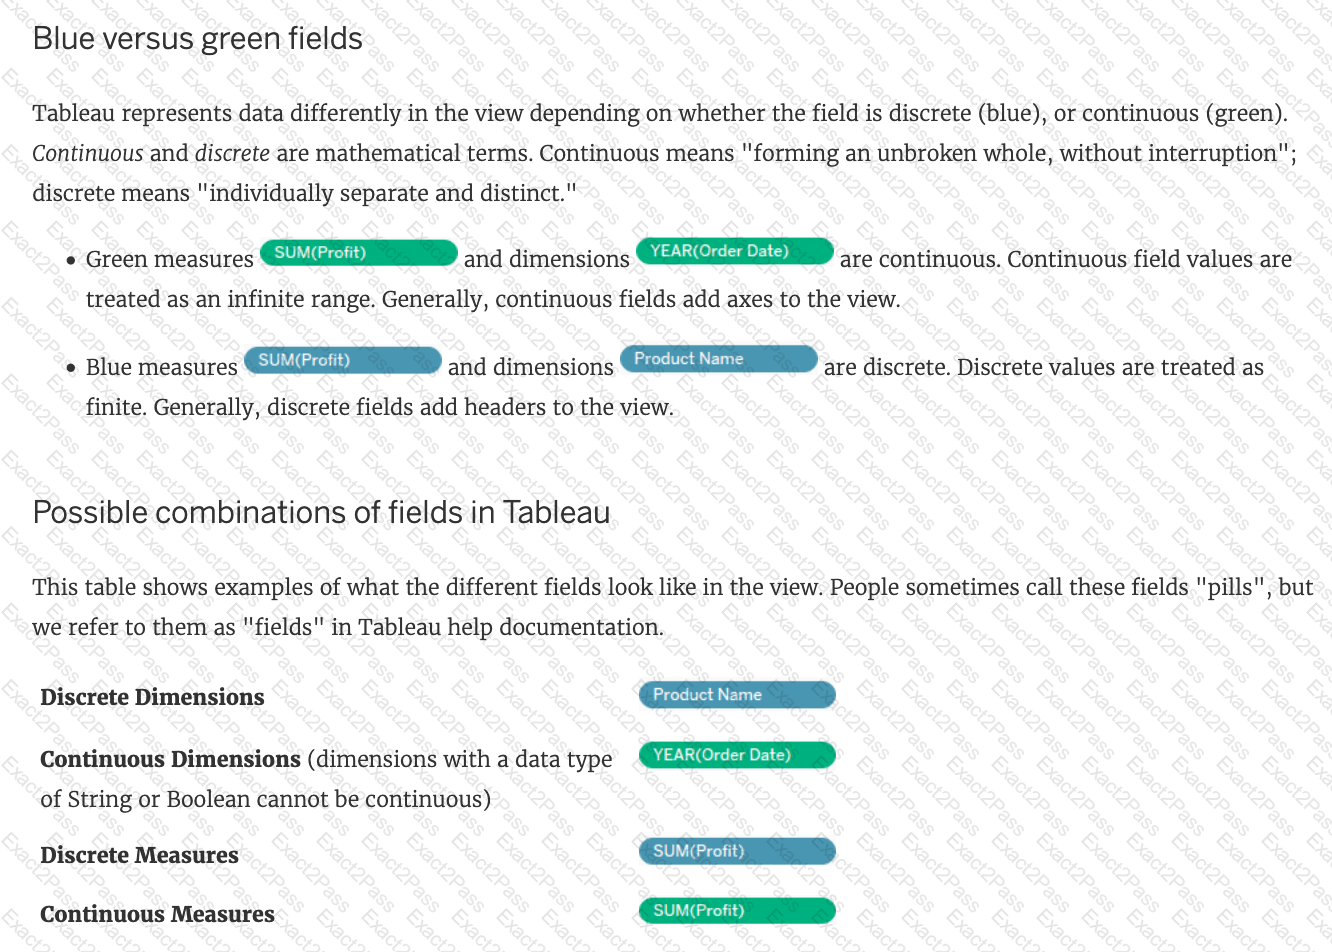
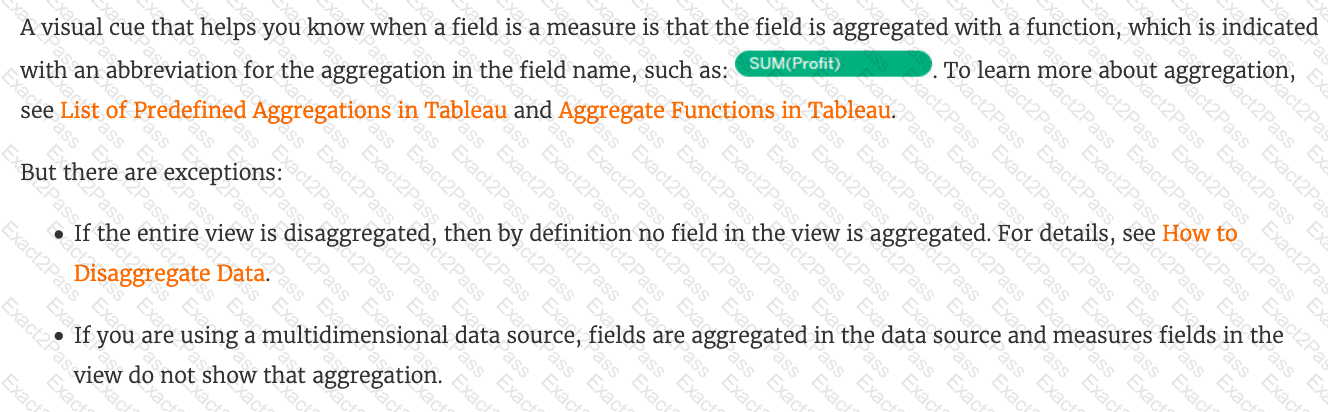
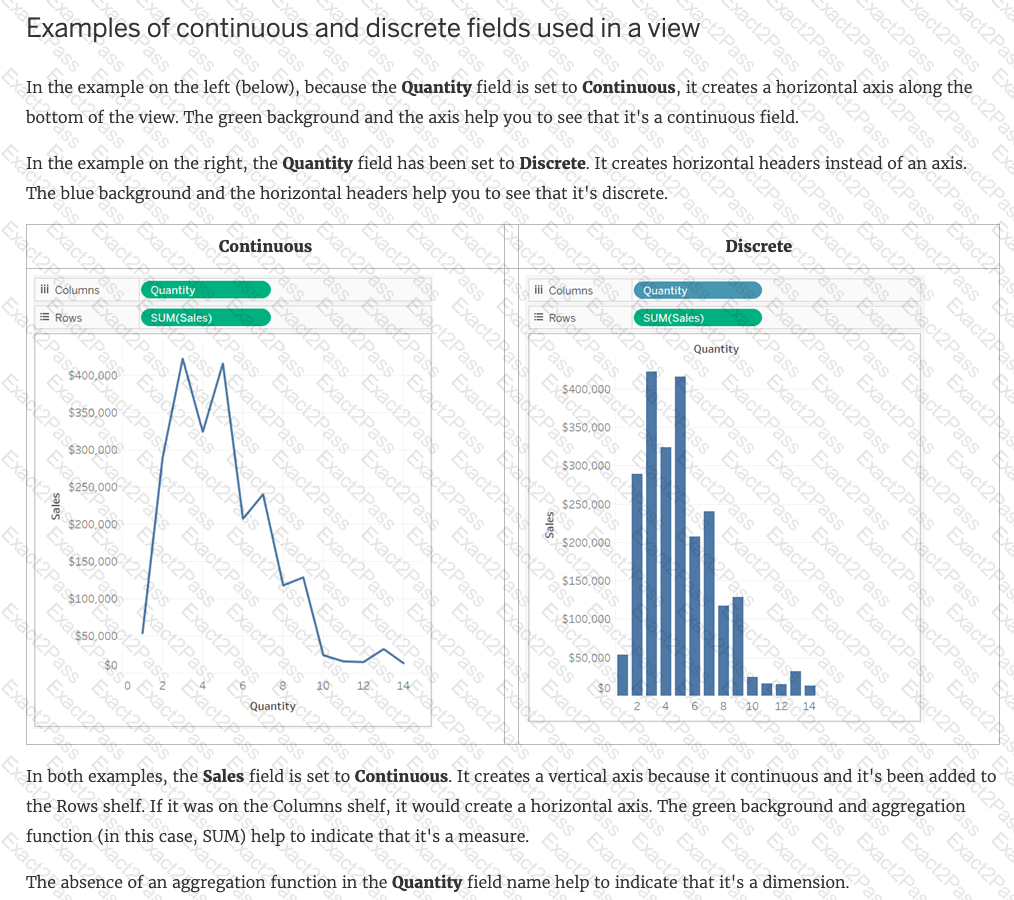
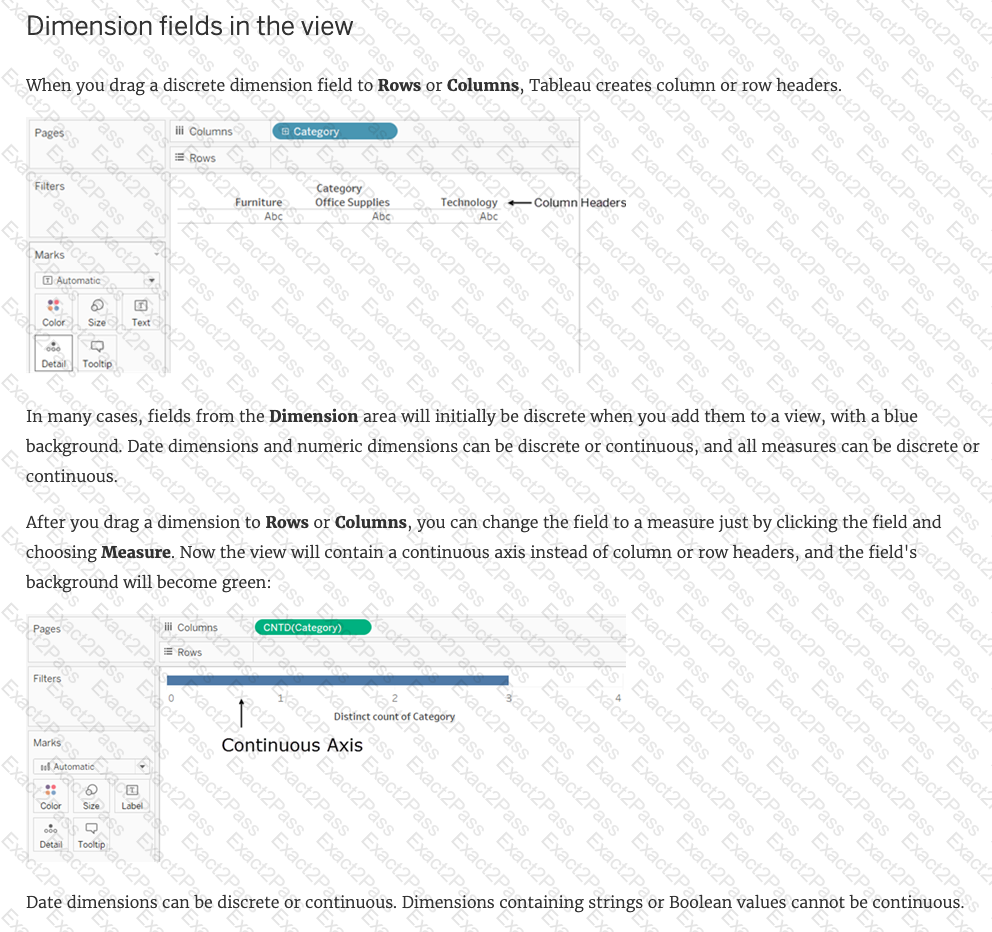
What do the colours Blue and Green represent in Tableau?
How would you calculate GDP per capita in Tableau?
What is a Tableau story point?
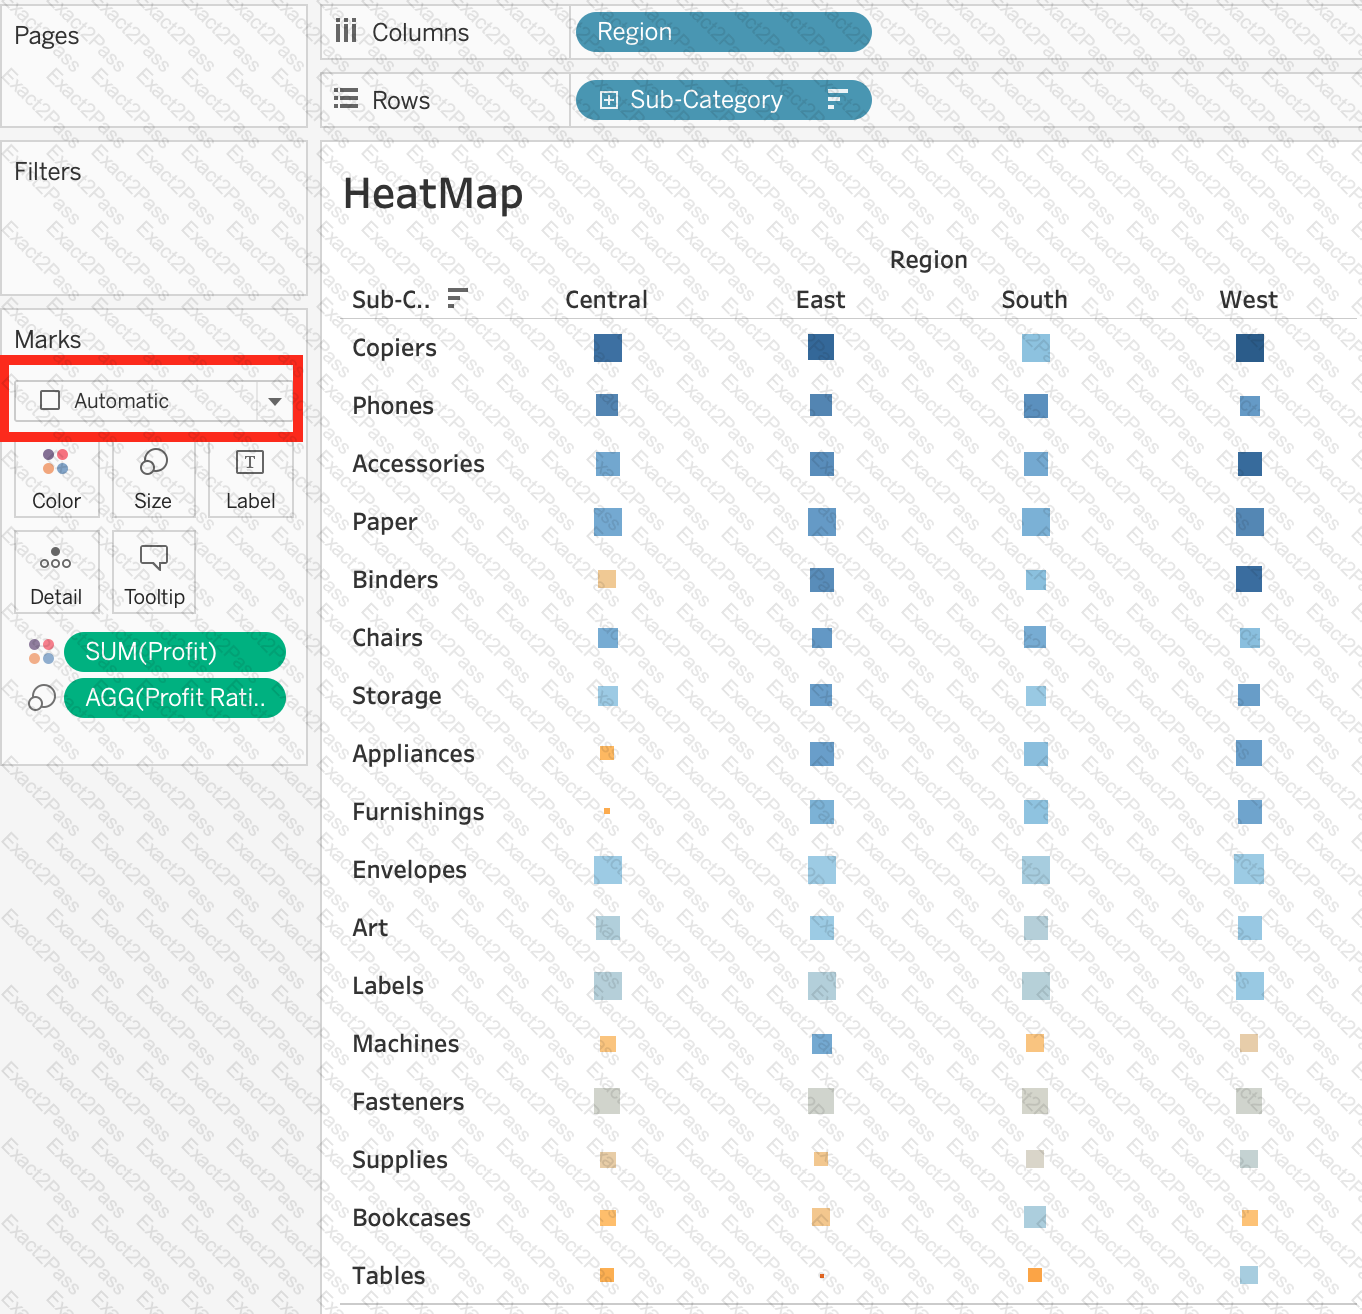
Which of the following shapes does a Heat Map use by default?
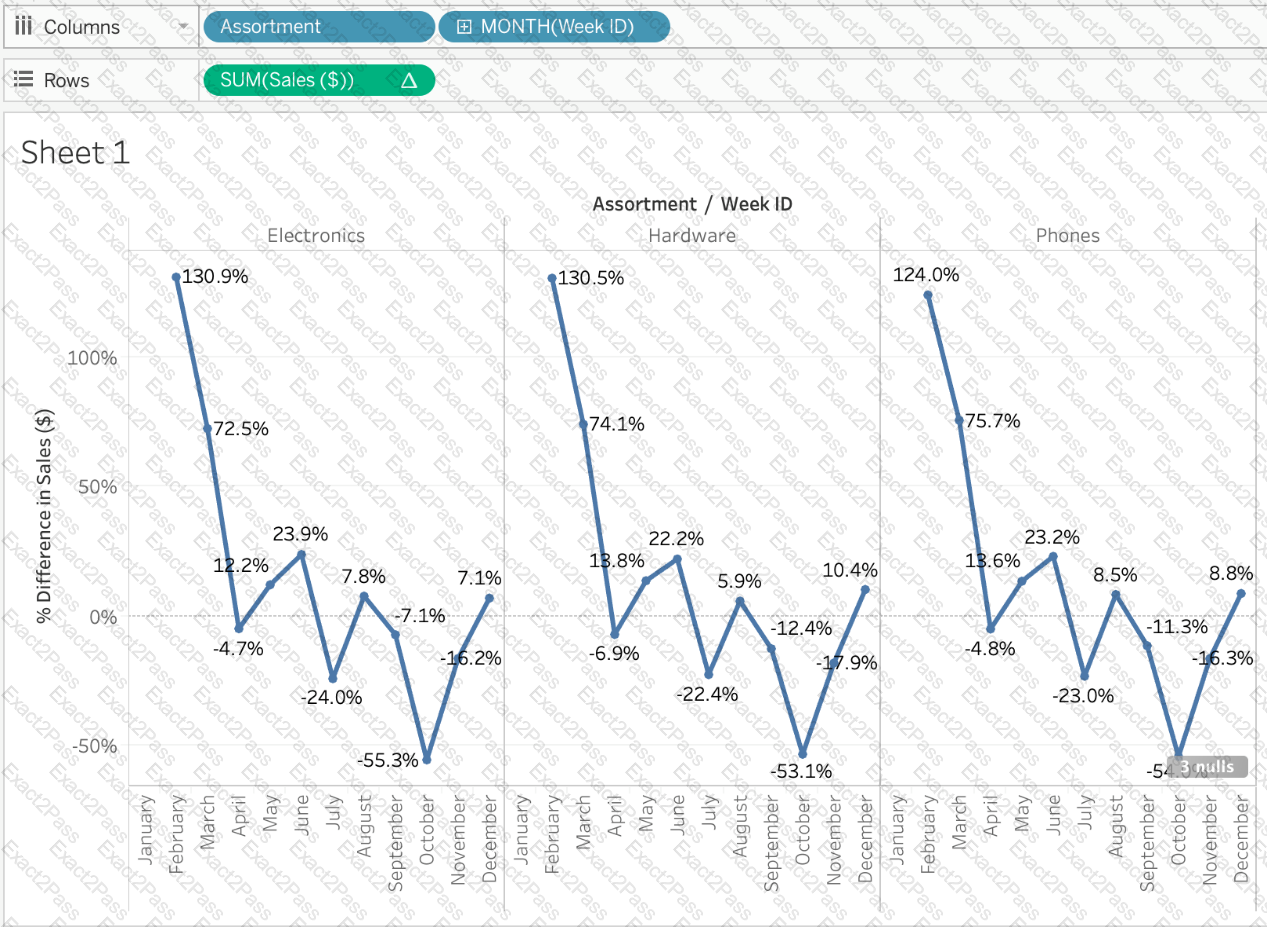
Using the Time Series Table, create a Line chart showing the Monthly Year over Year Growth for the Sales, broken down by Assortment. For the Electronics assortment, which Month had the most NEGATIVE value of Year over Year Growth?
Using the Time Series Table, create a Line chart showing the Monthly Year over Year Growth for the Sales, broken down by Assortment. For the Electronics assortment, which Month had the most NEGATIVE value of Year over Year Growth?
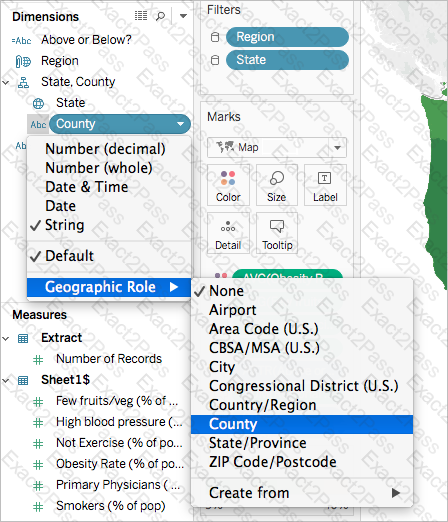
True or False: It is possible to change the Geographic Role of a dimension
Creating a scatter plot requires a minimum of how many measures?
From which three locations can you sort a visualization? Choose three.


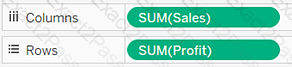 ( Simple Scatter Plot)
 (Matrix of Scatter Plots)