Last Update 5 hours ago Total Questions : 64
The Module 0 - Entry Exam content is now fully updated, with all current exam questions added 5 hours ago. Deciding to include IFoA_CAA_M0 practice exam questions in your study plan goes far beyond basic test preparation.
You'll find that our IFoA_CAA_M0 exam questions frequently feature detailed scenarios and practical problem-solving exercises that directly mirror industry challenges. Engaging with these IFoA_CAA_M0 sample sets allows you to effectively manage your time and pace yourself, giving you the ability to finish any Module 0 - Entry Exam practice test comfortably within the allotted time.
A cat rescue centre keeps a record of how many kittens are born in each litter over a year. The bar chart summarises the figures.
Consider the mean, mode and median of the number of kittens per litter.
Determine which one of the statements is true.
One of the two solutions to the equation is .

Determine the second solution.

A)

B)

C)

D)

A coin is tossed 7 times.
Calculate the number of possible combinations that gives 4 heads and 3 tails.
For random variable X, use the following statistics to calculate its coefficient of skewness based on central moments.
E(X) = 3.940
E(X2) = 21.466
skew(X) = E[(X - μ)3] = 6.008
Using simple iteration, based on trial and improvement, the cubic equation below can be solved:
2x3 + 5x2 +7x - 12 = 0
Solve for x to 6 decimal places.
X is a random variable with expected value E(X).
Identify which of the following is not a valid method for calculating the variance of X.
A discrete random variable can only take the values 2,3,4 or 5. The probabilities associated with some of the outcomes are: P(X=2) = 0.2, P(X=3) = 0.3, P(X=5) = 0.1.
For a randomly drawn value of X, calculate P(X > 3).
Calculate the sum of the following non-terminating progression:
2/10, 2/40, 2/160, 2/640,...
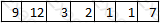
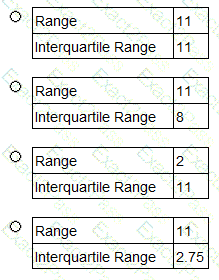
Assuming the position of the first quartile of an appropriately ordered dataset is given by

and the position of the third quartile of an appropriately ordered dataset is given by

Calculate the range and interquartile range of the above dataset.