Last Update 15 hours ago Total Questions : 100
The Salesforce Certified Tableau Consultant content is now fully updated, with all current exam questions added 15 hours ago. Deciding to include Analytics-Con-301 practice exam questions in your study plan goes far beyond basic test preparation.
You'll find that our Analytics-Con-301 exam questions frequently feature detailed scenarios and practical problem-solving exercises that directly mirror industry challenges. Engaging with these Analytics-Con-301 sample sets allows you to effectively manage your time and pace yourself, giving you the ability to finish any Salesforce Certified Tableau Consultant practice test comfortably within the allotted time.
From the desktop, open the CC workbook.
Open the Manufacturers worksheet.
The Manufacturers worksheet is used to
analyze the quantity of items contributed by
each manufacturer.
You need to modify the Percent
Contribution calculated field to use a Level
of Detail (LOD) expression that calculates
the percentage contribution of each
manufacturer to the total quantity.
Enter the percentage for Newell to the
nearest hundredth of a percent into the
Newell % Contribution parameter.
From the File menu in Tableau Desktop, click
Save.
A client is considering migrating from Tableau Server to Tableau Cloud.
Which two elements are determining factors of whether the client should use Tableau Server or Tableau Cloud? Choose two.
A company has a data source for sales transactions. The data source has the following characteristics:
. Millions of transactions occur weekly.
. The transactions are added nightly.
. Incorrect transactions are revised every week on Saturday.
· The end users need to see up-to-date data daily.
A consultant needs to publish a data source in Tableau Server to ensure that all the transactions in the data source are available.
What should the consultant do to create and publish the data?
A client wants to see the average number of orders per customer per month, broken down by region. The client has created the following calculated field:
Orders per Customer: {FIXED [Customer ID]: COUNTD([Order ID] )}
The client then creates a line chart that plots AVG(Orders per Customer) over MONTH(Order Date) by Region. The numbers shown by this chart are far higher
than the customer expects.
The client asks a consultant to rewrite the calculation so the result meets their expectation.
Which calculation should the consultant use?
A consultant builds a report where profit margin is calculated as SUM([Profit]) / SUM([Sales] ). Three groups of users are organized on Tableau Server with the
following levels of data access that they can be granted.
. Group 1: Viewers who cannot see any information on profitability
. Group 2: Viewers who can see profit and profit margin
. Group 3: Viewers who can see profit margin but not the value of profit
Which approach should the consultant use to provide the required level of access?
A client uses Tableau Data Management and notices that when they view a data source, they sometimes see a different count of workbooks in the Connected
Workbooks tab compared to the lineage count in Tableau Catalog.
What is the cause of this discrepancy?
A client collects information about a web browser customers use to access their website. They then visualize the breakdown of web traffic by browser version.
The data is stored in the format shown below in the related table, with a NULL BrowserID stored in the Site Visitor Table if an unknown browser version
accesses their website.
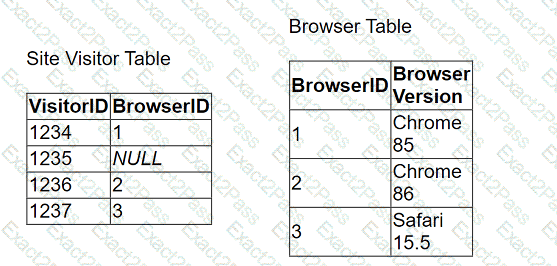
The client uses " Some Records Match " for the Referential Integrity setting because a match is not guaranteed. The client wants to improve the performance of
the dashboard while also getting an accurate count of site visitors.
Which modifications to the data tables and join should the consultant recommend?
Use the following login credentials to sign in
to the virtual machine:
Username: Admin
Password:
The following information is for technical
support purposes only:
Lab Instance: 40201223
To access Tableau Help, you can open the
Help.pdf file on the desktop.
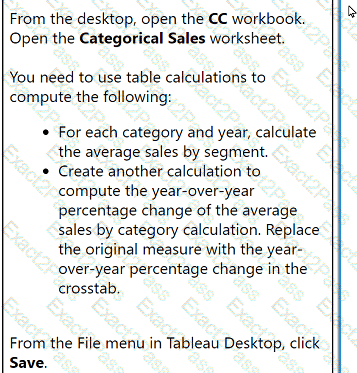
From the desktop, open the CC workbook.
Open the Categorical Sales worksheet.
You need to use table calculations to
compute the following:
. For each category and year, calculate
the average sales by segment.
. Create another calculation to
compute the year-over-year
percentage change of the average
sales by category calculation. Replace
the original measure with the year-
over-year percentage change in the
crosstab.
From the File menu in Tableau Desktop, click
Save.
From the desktop, open the CC workbook. Use the US Population Estimates data source.
You need to shape the data in US Population Estimates by using Tableau Desktop. The data must be formatted as shown in the following table.
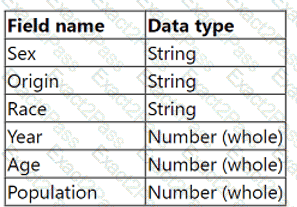
Open the Population worksheet. Enter the total number of records contained in the data set into the Total Records parameter.
From the File menu in Tableau Desktop, click Save.
From the desktop, open the CC workbook.
Open the City Pareto worksheet.
You need to complete the Pareto chart to show the percentage of sales compared to the percentage of cities. The chart must show references lines to visualize how the data compares to the Pareto principle.
From the File menu in Tableau Desktop, click Save.

