Last Update 12 hours ago Total Questions : 174
The Salesforce Certified Tableau Data Analyst content is now fully updated, with all current exam questions added 12 hours ago. Deciding to include Analytics-DA-201 practice exam questions in your study plan goes far beyond basic test preparation.
You'll find that our Analytics-DA-201 exam questions frequently feature detailed scenarios and practical problem-solving exercises that directly mirror industry challenges. Engaging with these Analytics-DA-201 sample sets allows you to effectively manage your time and pace yourself, giving you the ability to finish any Salesforce Certified Tableau Data Analyst practice test comfortably within the allotted time.
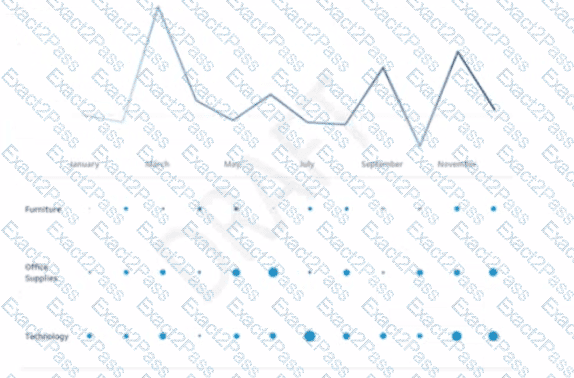
You have the following visualization.
You have a Tableau workbook.
You want to make the workbook available in Tableau Online.
What should you do?
You have the following dataset
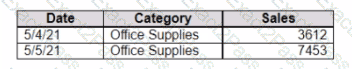
You need to create the following visualization.
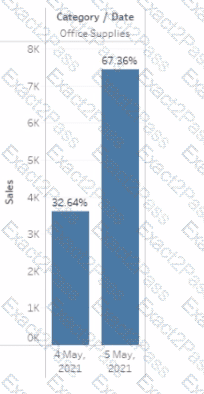
Which quick table calculation should you drag to Text on the Marks card?
A Data Analyst is given the following table and asked to create a flow that adds a date field to the data. This field should automatically update as new dates (months) are added to the original table.
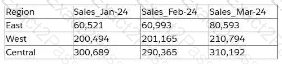
Which technique should the analyst use as the first step to achieve this in Tableau Prep?
A Data Analyst has a data source that has two tables named Table1 and Table2. Table1 is the primary table and Table2 is the secondary table.
The analyst wants to combine the tables by using Tableau Prep. The combined table must include only values from Table1 that do not match any values in Table2. The field values from Table2 must appear as null values.
Which type of join should the analyst use?
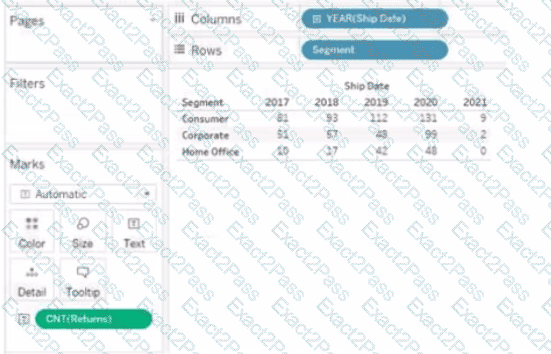
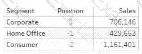
You have the following visualization.
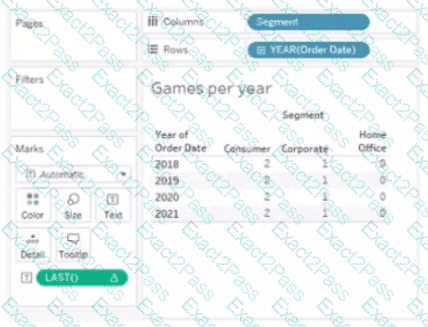
The Last() calculation is set to compute using Table (across)
Which value will appear in the crosstab for the Consumer segment of the year 2018 if you change compute to use Oder Dale?
You have the following bar chart.
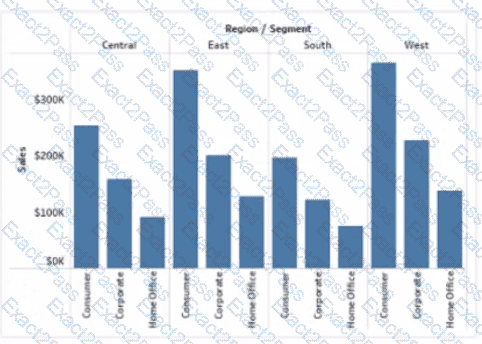
You want the chart to appear as shown in the Mowing exhibit.
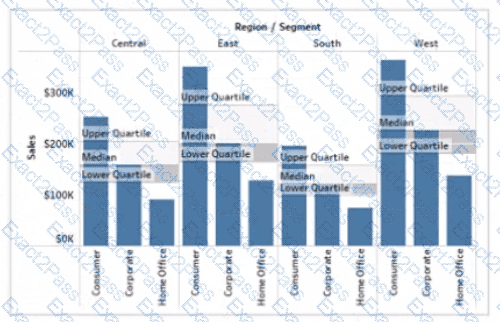
What should you add?
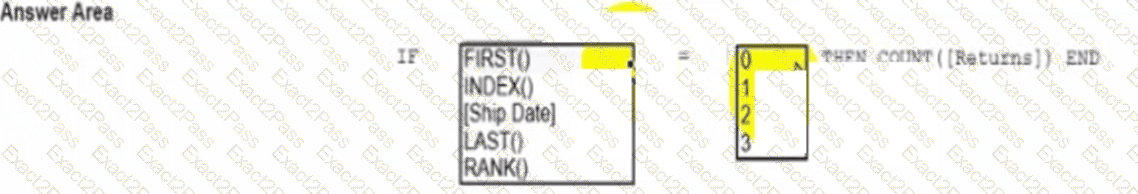
A Data Analyst wants to create the following table in a view:
Which function should the analyst use to create the Position column?
You want to add a draft watermark to a dashboard as shown in the following exhibit.
Which type of object should you use?
A Data Analyst at a coffee company has the following visualization already built.
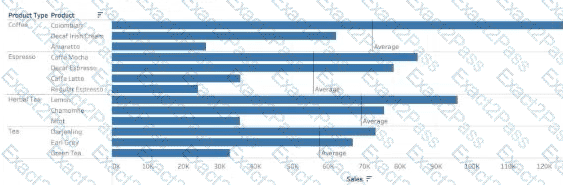
The analyst wants to make this more visually appealing by coloring the bars based on whether they are above or below the Average Sales within each Product Type.
Which calculation should the analyst use to calculate the Average Sales for each Product Type?


