Last Update 13 hours ago Total Questions : 174
The Salesforce Certified Tableau Data Analyst content is now fully updated, with all current exam questions added 13 hours ago. Deciding to include Analytics-DA-201 practice exam questions in your study plan goes far beyond basic test preparation.
You'll find that our Analytics-DA-201 exam questions frequently feature detailed scenarios and practical problem-solving exercises that directly mirror industry challenges. Engaging with these Analytics-DA-201 sample sets allows you to effectively manage your time and pace yourself, giving you the ability to finish any Salesforce Certified Tableau Data Analyst practice test comfortably within the allotted time.
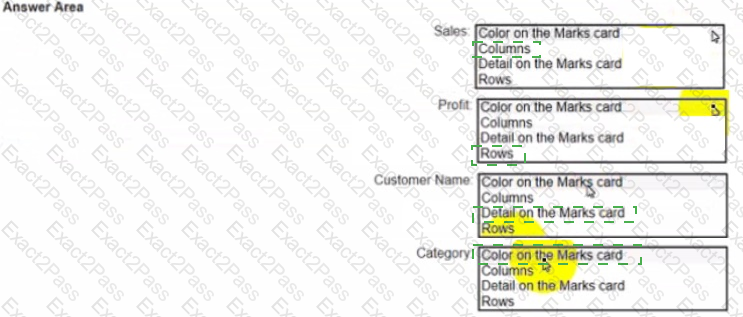
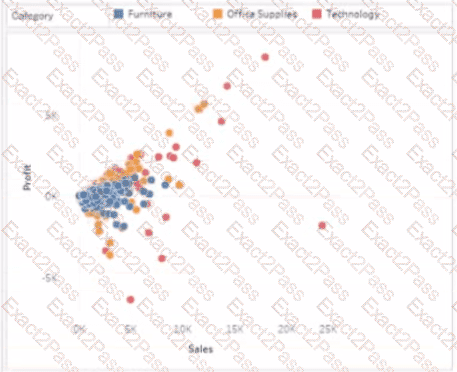
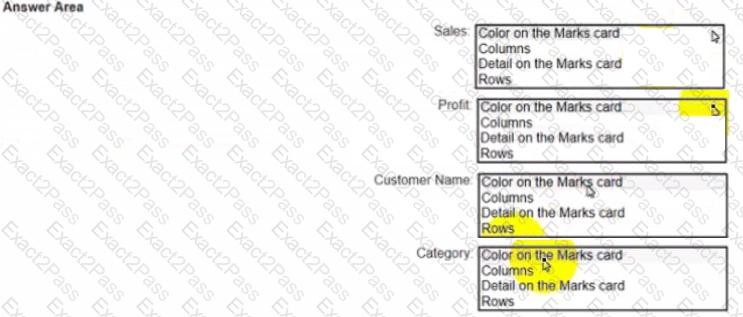
You have a dataset that has four fields named Category. Profit Sates and Customer Name. You need to create the following visualization.
You have the following dataset.
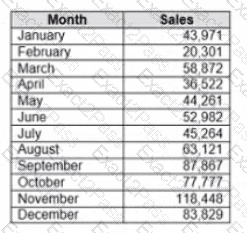
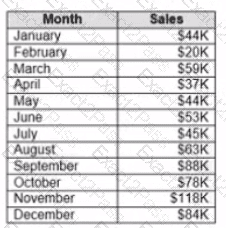
When you use the dataset in a worksheet, you want Sales to appear automatically as shown in the following table.
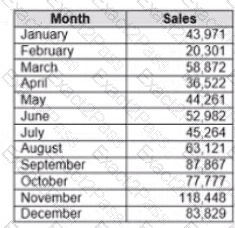
What should you do?
You have the following dataset in Microsoft Excel.
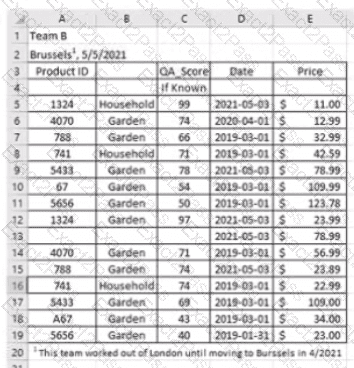
You are using Data interpreter to cleans the dataset. Data interpreter provides the following results.
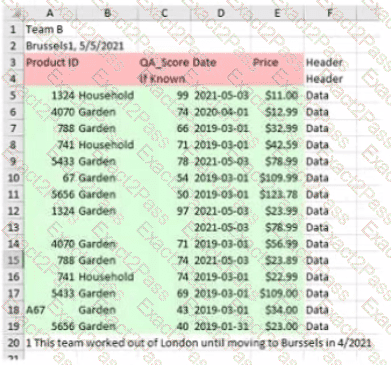
How many rows of data will be ingested into Tableau as values?
You have the following view.
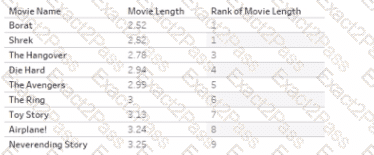
You want to filter the view lo show only records that have a movie name starting with the word. " The " . You must achieve the goal without writing any formulas.
Which type of filter should you use?
You have the following dataset:
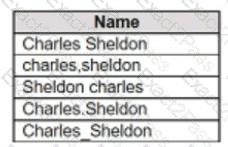
Which grouping option should you use in Tableau Prep to group all five names automatically?
Below are some of the values in the Order_ID field:
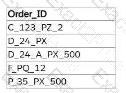
Which calculation should a Data Analyst use to return the two-letter combinations starting with the letter " P " for each of these values?
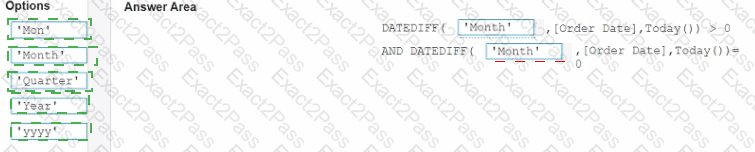
In a worksheet, you have a calculated column named YTD Sales that uses the following formula.
[Order Date] < = TODAY () AND DATETBUNC {“year”, [Order Dace]) = DATETPUNC) " year " , TODAY(J)
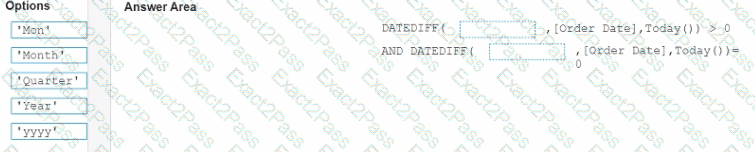
You want to create a calculated column named Exclude Current Month that will be dragged to the Filters shell. Exclude Current Month will exclude the current month values from YTD Sales.
How should you complete the formula for Exclude Current Month? (Drag the appropriate Options to the Answer Area and drop into the correct locations.)
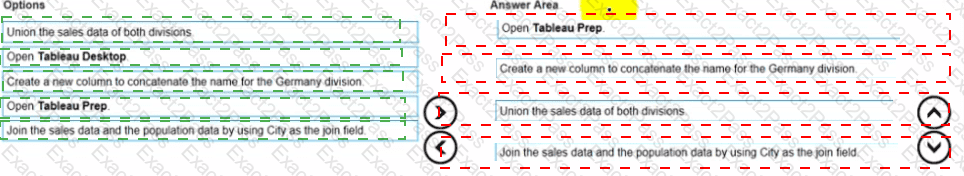
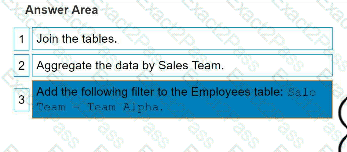
You are developing a data source in Tableau Prep.
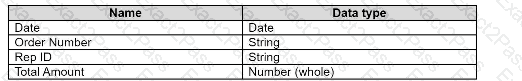
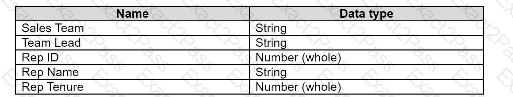
You have two tables named Orders and Employees.
The Orders table was created in 2019 and contains the following columns.
The Employees table contains all the employee information for the various sales teams in the sales department and contains the following columns
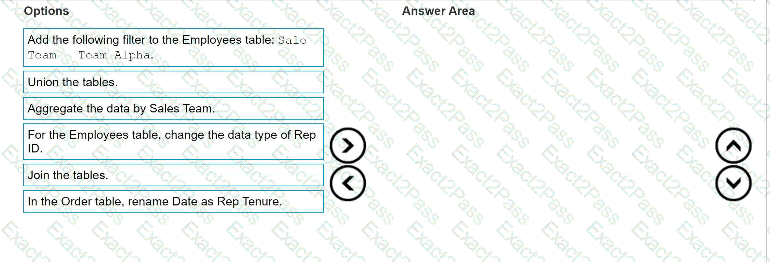
You want to prepare the data so that you can analyze sales trends over time for every sales team.
Which three actions should you perform in order? (Place the three correct options in order. Use the arrows to move Options to Answer Area. Use Answer Area arrows to re-order the options.)
You have a database that includes field named sales, City and Region.
You have the following chart that shows the number of sales made in different cities.
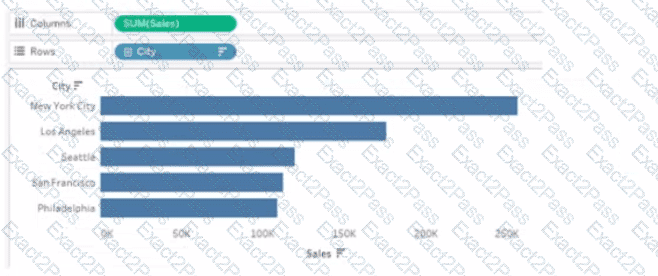
You want to dynamically show the corresponding region when users hover their mouse over any of the bars.
What should you do?
You have the following tiled dashboard that has one sheet.
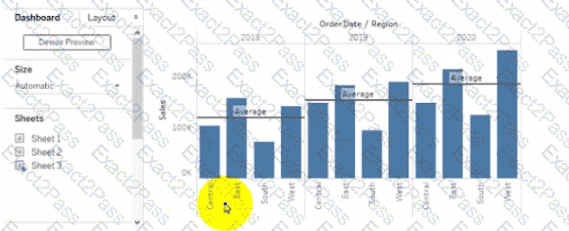
You want to replace the sheet with Sheet2.
What should you do?