Last Update 19 hours ago Total Questions : 40
The Looker Business AnalystExam content is now fully updated, with all current exam questions added 19 hours ago. Deciding to include Looker-Business-Analyst practice exam questions in your study plan goes far beyond basic test preparation.
You'll find that our Looker-Business-Analyst exam questions frequently feature detailed scenarios and practical problem-solving exercises that directly mirror industry challenges. Engaging with these Looker-Business-Analyst sample sets allows you to effectively manage your time and pace yourself, giving you the ability to finish any Looker Business AnalystExam practice test comfortably within the allotted time.
An analyst creates a column chart showing the count of total orders and the count of returned orders on each date. The number of returned orders is much smaller than the number of total orders, so the columns for the returned orders are short and it is difficult to compare all the columns visually.
How should the analyst ensure that the differences between returned order counts for each day are more visible?
An analyst works on the data team at an organization that maintains multiple similar Explores. The analyst has access to see every Explore, but knows that employees in the finance department only have access to explores tagged Finance.
There is an Employee Compensation Data Finance Explore that the finance department has access to. The analyst usually uses an All Employee Data Explore that also includes personally identifiable information.
What should the analyst do to ensure proper access if the analyst wants to send an example visualization to the finance team?
A business analyst is creating an Explore that shows the number of hotel rooms booked per week, by room type. The analyst is using a Week dimension and a Count measure, and is provisioning on a Room Type dimension. Looking at the results, the Count of King rooms seems unusually low one week.
What should the analyst do to further investigate the low numbers?
An analyst has a dashboard with a single filter on Created Date “is in the past year”, but a tile on the dashboard is returning results for only the past 7 days. When the analyst selects “Explore from Here” on the tile, there are filters on both Created Date “is in the past year” and Created Time “is in the past 7 days”.
How should the analyst make sure that only the filter set on the dashboard is applied to the tile?
A global dashboard filter and the filter on a tile within that dashboard conflict because the global dashboard filter and the individual tile filter are based on the same field with different filter values.
What happens in this situation?
Two users report seeing different results on the same dashboard.
Which three configurations could explain these discrepancies? (Choose three.)
Two weeks into the third quarter, an analyst needs to determine the total order count per month for only the first two quarters.
How should the analyst filter the query?
An analyst needs to compare monthly sales, year over year, based on when an order was created, as shown in the exhibit.
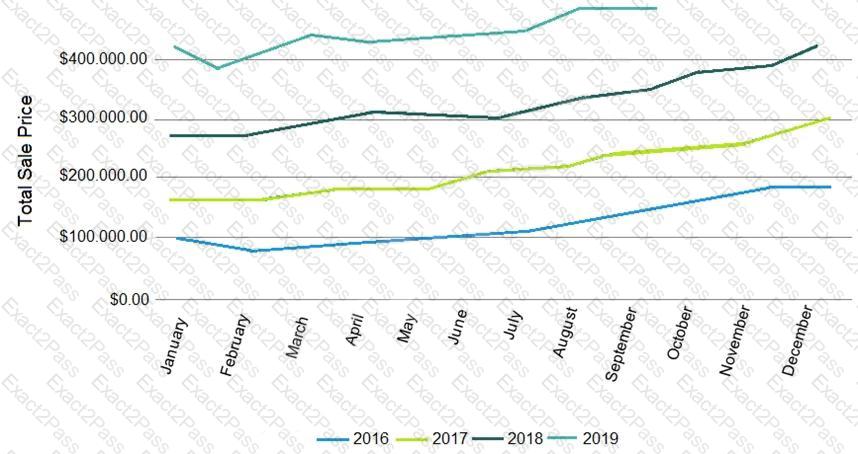
How should the analyst, in addition to selecting the measure Total Sales build the report?
An analyst wants to schedule a dashboard in a way that makes it easier for viewing on a mobile device or for viewing a printout of the dashboard.
How can the analyst set up a schedule to accomplish this?
An analyst creates a table visualization. There is one dimension, a few count type measures, and a percentage table calculation. When the analyst tries to download all 200,000 rows of results in CSV, the option is unavailable. The analyst has been provided permission to download all results.
Which action should the analyst take to download all results?

