Last Update 22 hours ago Total Questions : 55
The Tableau Certified Consultant content is now fully updated, with all current exam questions added 22 hours ago. Deciding to include TCC-C01 practice exam questions in your study plan goes far beyond basic test preparation.
You'll find that our TCC-C01 exam questions frequently feature detailed scenarios and practical problem-solving exercises that directly mirror industry challenges. Engaging with these TCC-C01 sample sets allows you to effectively manage your time and pace yourself, giving you the ability to finish any Tableau Certified Consultant practice test comfortably within the allotted time.
An online sales company has a table data source that contains Order Date. Products ship on the first day of each month for all orders from the previous month.
The consultant needs to know the average number of days that a customer must wait before a product is shipped.
Which calculation should the consultant use?
Use the following login credentials to sign in
to the virtual machine:
Username: Admin
Password:
The following information is for technical
support purposes only:
Lab Instance: 40201223
To access Tableau Help, you can open the
Help.pdf file on the desktop.
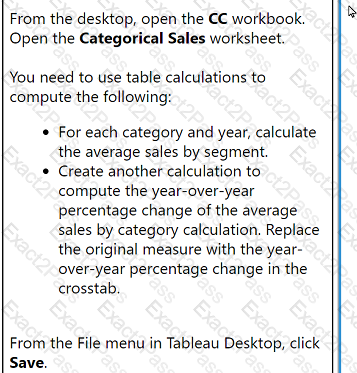
From the desktop, open the CC workbook.
Open the Categorical Sales worksheet.
You need to use table calculations to
compute the following:
. For each category and year, calculate
the average sales by segment.
. Create another calculation to
compute the year-over-year
percentage change of the average
sales by category calculation. Replace
the original measure with the year-
over-year percentage change in the
crosstab.
From the File menu in Tableau Desktop, click
Save.
From the desktop, open the CC workbook.
Open the City Pareto worksheet.
You need to complete the Pareto chart to show the percentage of sales compared to the percentage of cities. The chart must show references lines to visualize how the data compares to the Pareto principle.
From the File menu in Tableau Desktop, click Save.
A consultant migrated a data source to improve performance. The consultant wants to identify which workbooks need to be updated to point to the new data
source.
Which Tableau tool should the consultant use?
From the desktop, open the CC workbook.
Open the Incremental worksheet.
You need to add a line to the chart that
shows the cumulative percentage of sales
contributed by each product to the
incremental sales.
From the File menu in Tableau Desktop, click
Save.
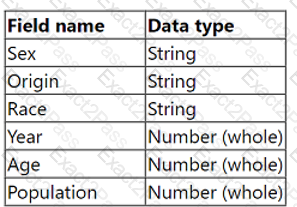
From the desktop, open the CC workbook. Use the US Population Estimates data source.
You need to shape the data in US Population Estimates by using Tableau Desktop. The data must be formatted as shown in the following table.
Open the Population worksheet. Enter the total number of records contained in the data set into the Total Records parameter.
From the File menu in Tableau Desktop, click Save.

