Exact2Pass

Last Update 3 hours ago Total Questions : 470
The Microsoft Power BI Data Analyst content is now fully updated, with all current exam questions added 3 hours ago. Deciding to include PL-300 practice exam questions in your study plan goes far beyond basic test preparation.
You'll find that our PL-300 exam questions frequently feature detailed scenarios and practical problem-solving exercises that directly mirror industry challenges. Engaging with these PL-300 sample sets allows you to effectively manage your time and pace yourself, giving you the ability to finish any Microsoft Power BI Data Analyst practice test comfortably within the allotted time.
You have a collection of reports for the HR department of your company.
You need to create a visualization for the HR department that shows a historic employee counts and predicts trends during the next six months.
Which type of visualization should you use?
You have a Power Bl report that contains a table visual The visual contains a column.
The column contains whole numbers ranging from o* 1 to 20.
You need to use conditional formatting to meet the following requirements:
• Visually compare the values without having to read the text containing the number.
• Show a different format for each distinct value
• Hide the numeric value of ColumnA.
• Minimize development effort.
Which formatting should you use?
You have a Power BI model that has the following tables:
Product (Product_id, Product_Name)
Sales (Order_id, Order_Date, Product_id, Salesperson_id, Sales_Amount)
Salesperson (Salesperson_id, Salesperson_name, address)
You plan to create the following measure.
Measure1 = DISTINCTCOUNT(Sales[ProductID])
You need to create the following relationships:
Sales to Product
Sales to Salesperson
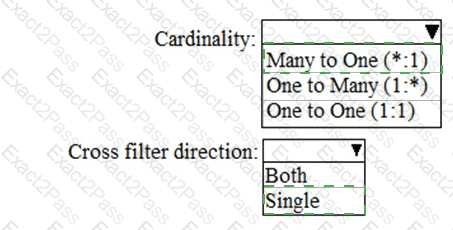
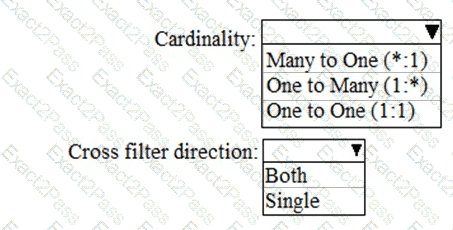
The solution must ensure that you can use Measure1 to display the count of products sold by each salesperson.
How should you configure the relationships? To answer, select the appropriate options in the answer area.
NOTE: Each correct selection is worth one point.
You need to ensure that the data is updated to meet the report requirements. The solution must minimize configuration effort.
What should you do?
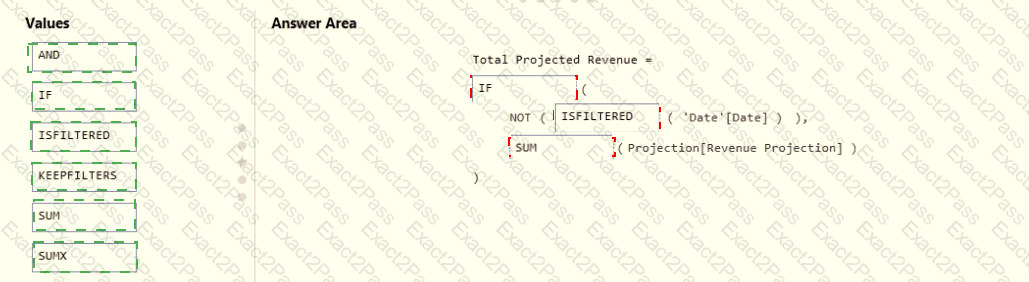
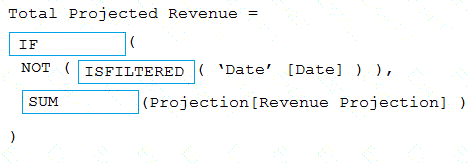
You need to create a DAX measure in the data model that only allows users to see projections at the appropriate levels of granularity.
How should you complete the measure? To answer, drag the appropriate values to the correct targets. Each value may be used once, more than once, or not at all. You may need to drag the split bar between panes or scroll to view content.
NOTE: Each correct selection is worth one point.

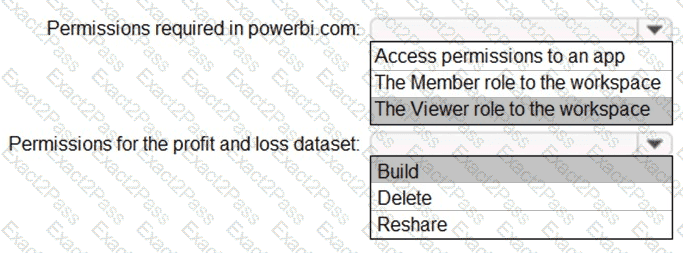
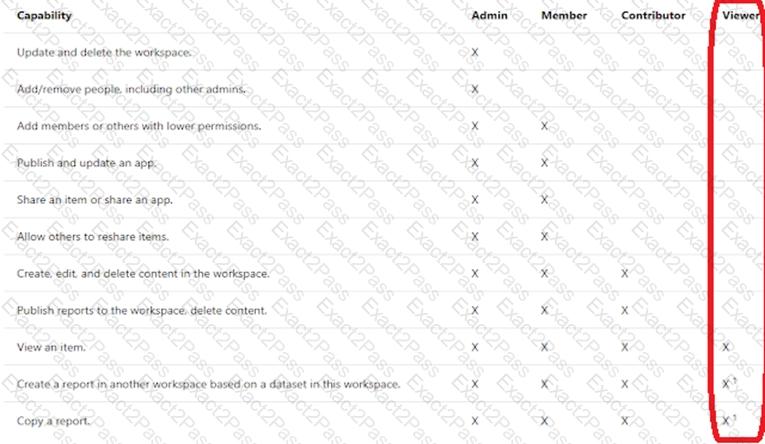
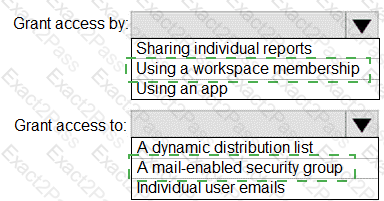
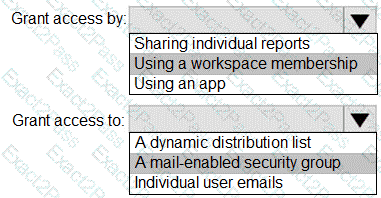
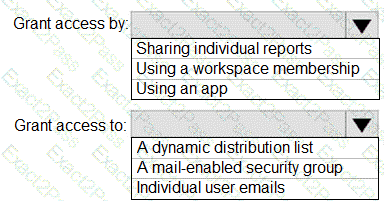
You need to grant access to the business unit analysts.
What should you configure? To answer, select the appropriate options in the answer area.
NOTE: Each correct selection is worth one point.

Which DAX expression should you use to get the ending balances in the balance sheet reports?
Which two types of visualizations can be used in the balance sheet reports to meet the reporting goals? Each correct answer presents part of the solution.
NOTE: Each correct selection is worth one point.
How should you distribute the reports to the board? To answer, select the appropriate options in the answer area.
NOTE: Each correct selection is worth one point.
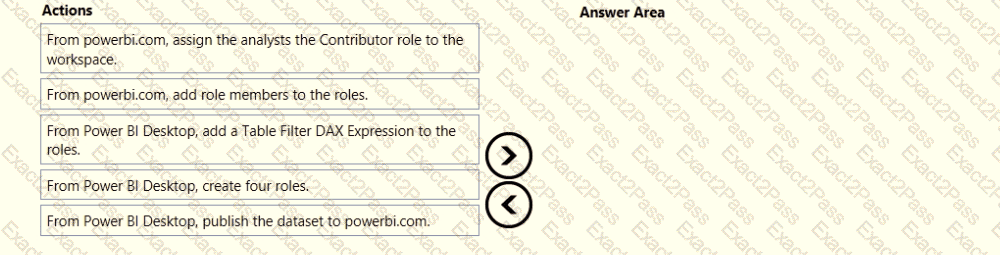
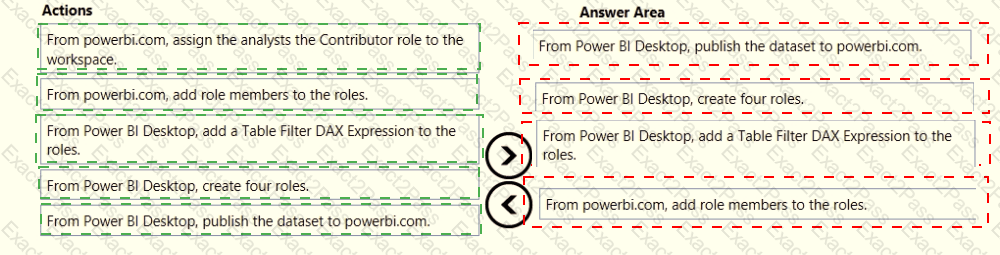
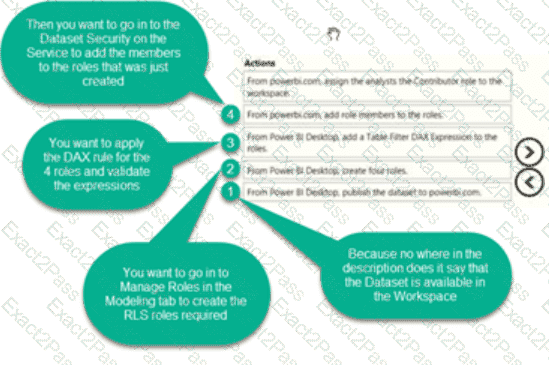
Once the profit and loss dataset is created, which four actions should you perform in sequence to ensure that the business unit analysts see the appropriate profit and loss data? To answer, move the appropriate actions from the list of actions to the answer area and arrange them in the correct order.