Exact2Pass

Last Update 3 hours ago Total Questions : 470
The Microsoft Power BI Data Analyst content is now fully updated, with all current exam questions added 3 hours ago. Deciding to include PL-300 practice exam questions in your study plan goes far beyond basic test preparation.
You'll find that our PL-300 exam questions frequently feature detailed scenarios and practical problem-solving exercises that directly mirror industry challenges. Engaging with these PL-300 sample sets allows you to effectively manage your time and pace yourself, giving you the ability to finish any Microsoft Power BI Data Analyst practice test comfortably within the allotted time.
You have a Microsoft Power Bl report. The size of PBIX file is 550 MB. The report is accessed by using an App workspace in shared capacity of powerbi.com.
The report uses an imported dataset that contains one fact table. The fact table contains 12 million rows. The dataset is scheduled to refresh twice a day at 08:00 and 17:00.
The report is a single page that contains 15 custom visuals and 10 default visuals.
Users say that the report is slow to load the visuals when they access and interact with the report
You need to recommend a solution to improve the performance of the report.
What should you recommend?
You have a Power B1 semantic model that contains tour queries named Query 1, Query2, Query3, and Query4, Query1 loads customer data Into the model and is referenced by the other three queries. You discover that data refresh for the model is slow.
You need to improve the data refresh time. The solution must minimi2e costs. What should you do?
You have a Microsoft Power Bl workspace.
You need to grant the user capabilities shown in the following table.

The solution must use the principle of least privilege.
Which user role should you assign to each user? To answer, drag the appropriate roles to the correct users. Each role may be used once, more than once, or not at all. You may need to drag the split bar between panes or scroll to view content.
NOTE: Each correct selection is worth one point.

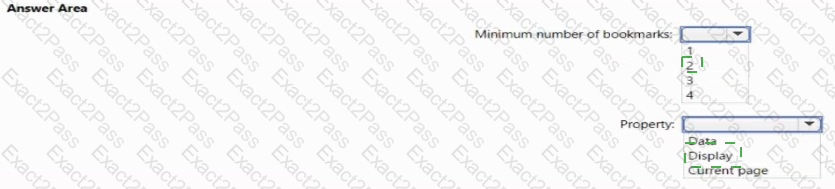
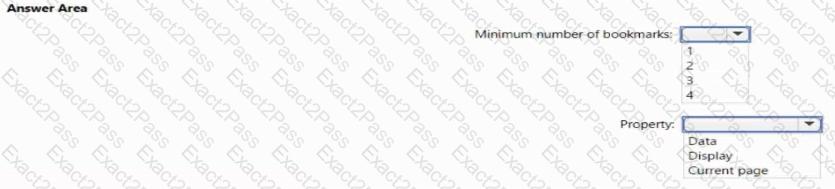
You need to create a Power Bl report. The first page or the report must contain the following two views:
* Sales By Postal Code
* Sales by Month
Both views must display a slicer to select a value for a field named Chain.
The Sales By Postal Code view must display a map visual as shown in the following exhibit.
You are reviewing a query that produces 10,000 rows in the Power Query Editor.
You need to identify whether a column contains only unique values.
Which two Data Preview options can you use? Each correct answer presents a complete solution.
NOTE: Each correct selection is worth one point.
NO: 18
You embed a Power BI report in a Microsoft SharePoint Online page.
A user name User1 can access the SharePoint Online page, but the Power BI web part displays the following error message: “This content isn’t available”.
User1 is unable to view the report.
You verify that you can access the SharePoint Online page and that the Power BI report displays as expected.
You need to ensure that User1 can view the report form SharePoint Online.
What should you do?
Your organization has a team of power users who recently created 20 Power BI dashboards.
The power users share the dashboards with other users in the organization.
When the users attempt to access the dashboards, they receive the error message shown in the exhibit. (Click the Exhibit.)
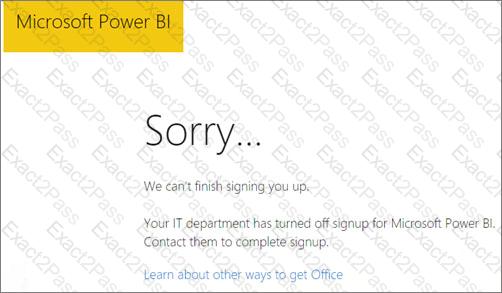
You need to ensure that all the users can access the dashboards.
What should you do first?
You have the visual shown in the exhibit. (Click the Exhibit tab.)
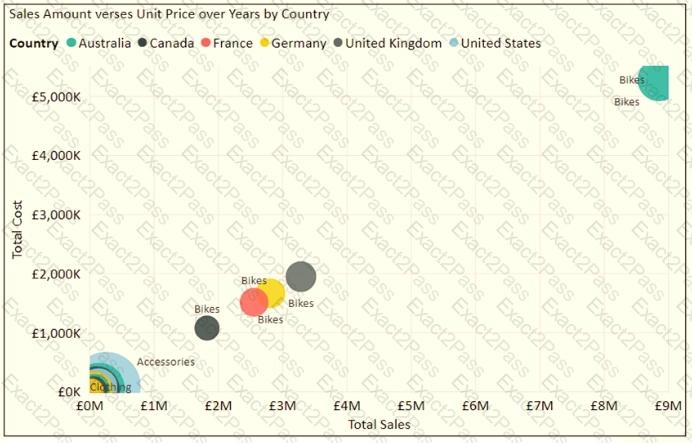
You need to show the relationship between Total Cost and Total Sales over time.
What should you do?
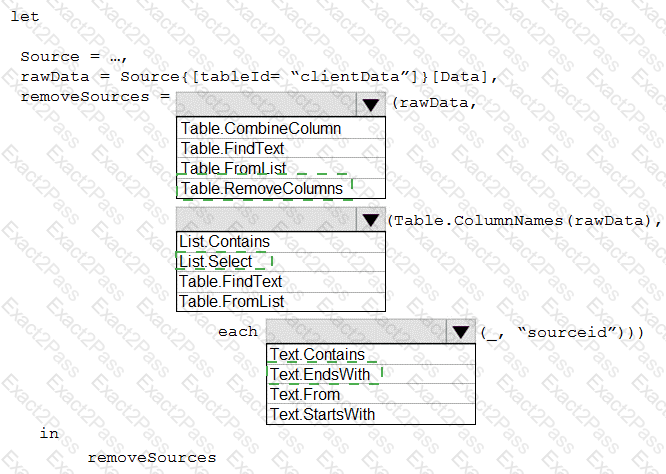
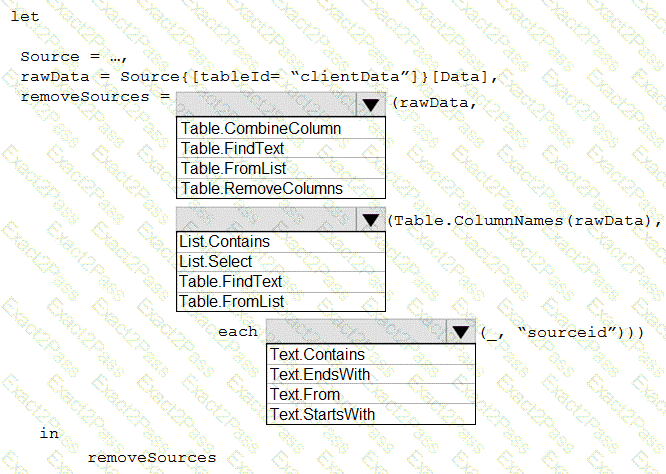
You have an API that returns more than 100 columns. The following is a sample of column names.
client_notified_timestamp
client_notified_source
client_notified_sourceid
client_notified_value
client_responded_timestamp
client_responded_source
client_responded_sourceid
client_responded_value
You plan to include only a subset of the returned columns.
You need to remove any columns that have a suffix of sourceid.
How should you complete the Power Query M code? To answer, select the appropriate options in the answer area.
NOTE: Each correct selection is worth one point.
You have a semantic model that contains a table named Employees. The table contains the following columns:
• Employee ID
• First Name
• Last Name
• Department
• Salary
Each employee is uniquely identified by using Employee ID.
You need to create a DAX measure that will calculate the average salary of all the employees in the sales department.
Which DAX expression should you use?