Exact2Pass

Last Update 3 hours ago Total Questions : 470
The Microsoft Power BI Data Analyst content is now fully updated, with all current exam questions added 3 hours ago. Deciding to include PL-300 practice exam questions in your study plan goes far beyond basic test preparation.
You'll find that our PL-300 exam questions frequently feature detailed scenarios and practical problem-solving exercises that directly mirror industry challenges. Engaging with these PL-300 sample sets allows you to effectively manage your time and pace yourself, giving you the ability to finish any Microsoft Power BI Data Analyst practice test comfortably within the allotted time.
Note: This question is part of a series of questions that present the same scenario. Each question in the series contains a unique solution that might meet the stated goals. Some question sets might have more than one correct solution, while others might not have a correct solution.
After you answer a question in this section, you will NOT be able to return to it. As a result, these questions will not appear in the review screen.
You create a parameter named DataSourceExcel that holds the file name and location of a Microsoft Excel data source.
You need to update the query to reference the parameter instead of multiple hard-coded copies of the location within each query definition.
Solution: You modify the source step of the queries to use DataSourceExcel as the file path.
Does this meet the goal?
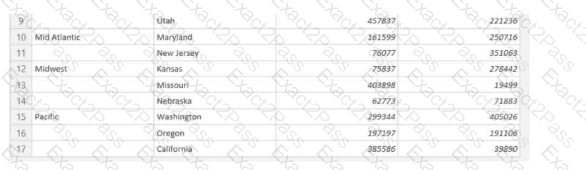
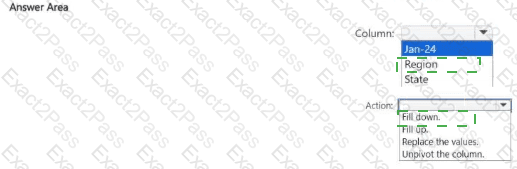
Each Region value appears only on the tow where it first occurred. Each subsequent occurrence of the Region value is blank.
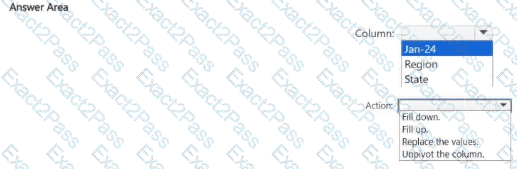
You need to ensure that every row contains the connect non-blank value The solution must minimize development effort.
Which column should you select, and which action should you perform on the column? To answer, select the appropriate options in the answer area. NOTE; Each connect selection is worth one point.
You have a Power BI report named Report ' and a dashboard named Dashboard ' . Report1 contains a line chart named Sales by month.
You pin the Sales by month visual to Dashboard1.
In Report1, you change the Sales by month visual to a bar chart.
You need to ensure that the bar chart displays on Dashboard ' ,
What should you do?
You have a Power BI model that contains the following data.
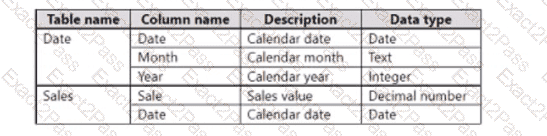
The Date table relates to the Sales table by using the Date columns.
You need to create a calculated table that v/ill contain the following:

Note: This question is part of a series of questions that present the same scenario. Each question in the series contains a unique solution that might meet the stated goals. Some question sets might have more than one correct solution, while others might not have a correct solution.
After you answer a question in this section, you will NOT be able to return to it. As a result, these questions will not appear in the review screen,
You create a parameter named DataSourceExcel that holds the file name and location of a Microsoft Excel data source.
You need to update the query to reference the parameter instead of multiple hard-coded copies of the location within each query definition.
Solution: In the Power Query M code, you replace references to the Excel file with DataSourceExcel.
Does this meet the goal?
From Power Query Editor, you attempt to execute a query and receive the following error message.
Datasource.Error: could not find file.
What are two possible causes of the error? Each correct answer presents a complete solution.
NOTE: Each correct selection is worth one point.
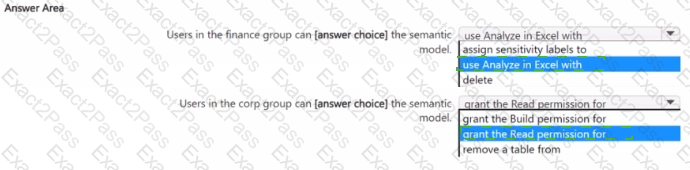
You have a semantic model that has the permissions shown in the following exhibit.
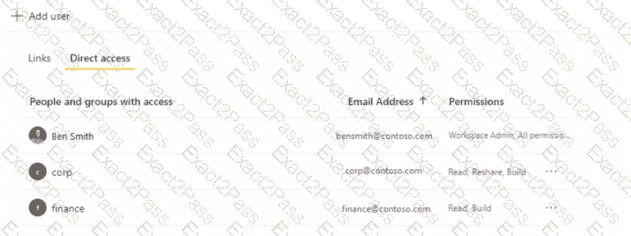
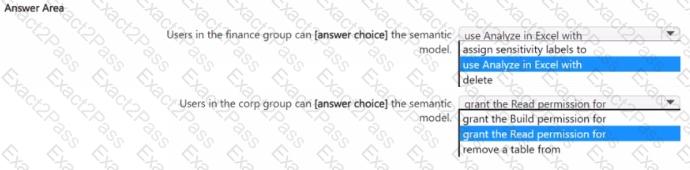
Use the drop-down menus to select the answer choice the that completes each statement based on the information presented in the graphic.
NOTE: Each correct selection is worth one point.
You have a Microsoft SharePoint Online site that contains several document libraries. One of the document libraries contains manufacturing reports saved as Microsoft Excel files. All the manufacturing reports have the same data structure.
You need to load only the manufacturing reports to a table for analysis.
What should you do in Microsoft Power Bl Desktop?
You have two tables named Customers and Invoice in a Power BI model. The Customers table contains the following fields:
CustomerID
Customer City
Customer State
Customer Name
Customer Address 1
Customer Address 2
Customer Postal Code
The Invoice table contains the following fields:
Order ID
Invoice ID
Invoice Date
Customer ID
Total Amount
Total Item Count
The Customers table is related to the Invoice table through the Customer ID columns. A customer can have many invoices within one month.
The Power BI model must provide the following information:
The number of customers invoiced in each state last month
The average invoice amount per customer in each postal code
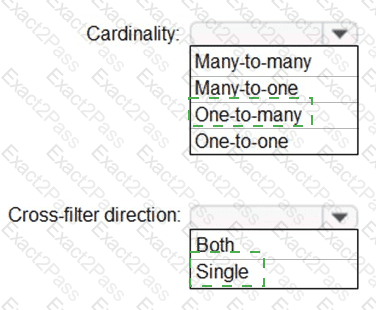
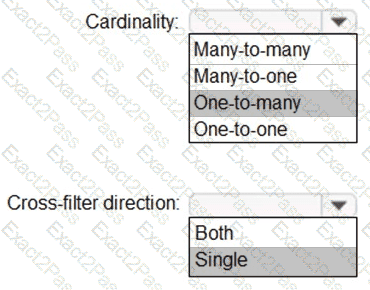
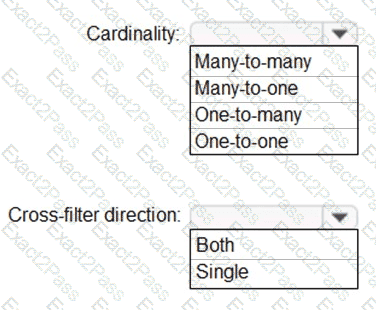
You need to define the relationship from the Customers table to the Invoice table. The solution must optimize query performance.
What should you configure? To answer, select the appropriate options in the answer area.
NOTE: Each correct selection is worth one point.
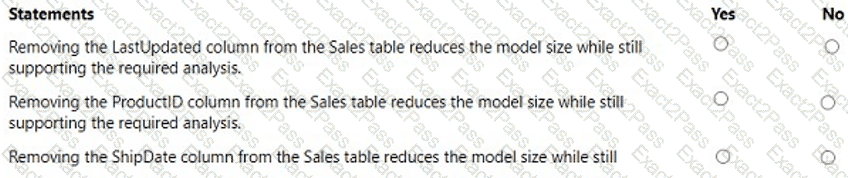
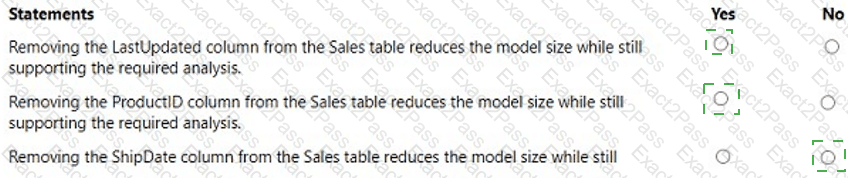
The data model must support the following analysis:
Total sales by product by month in which the order was placed
Quantities sold by product by day on which the order was placed
Number Of sales transactions by quarter in Which the order was placed
For each Of the following statements, select Yes if the statement is true. Otherwise, select NO.