Last Update 23 hours ago Total Questions : 100
The Qlik Sense Business Analyst Certification Exam - 2022 content is now fully updated, with all current exam questions added 23 hours ago. Deciding to include QSBA2022 practice exam questions in your study plan goes far beyond basic test preparation.
You'll find that our QSBA2022 exam questions frequently feature detailed scenarios and practical problem-solving exercises that directly mirror industry challenges. Engaging with these QSBA2022 sample sets allows you to effectively manage your time and pace yourself, giving you the ability to finish any Qlik Sense Business Analyst Certification Exam - 2022 practice test comfortably within the allotted time.
A business analyst needs to share a link to a specific visualization with colleagues
Which steps should the business analyst use?
Refer to the exhibits.
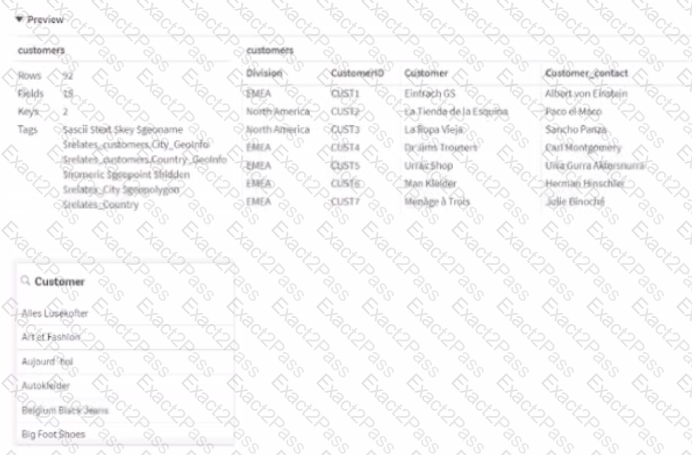
These tables have the same structure. The Customers information is as shown in the Data Model Viewer In a sheet called "Customer Analysis" there is a filter pane with Customers.
A business analyst s developing an app for the Sales department and loads the data about Customers from two files.
The business analyst wants the values to appear as they were loaded How should this issue be resolved?
A sales manager needs to visualize the company's sales. The sales manager needs to understand how sates and profitability are related over time. The visualization will be used in a printed annual report.
The business analyst has access to the following data:
• Order Dates
• Order ID
• Total Safes by Order
• Net profit margin%
• Cost of Goods Sow (COGS)
Which visualization should the business analyst use?
To improve efficiencies a hospital must analyze how often a surgery is started late by operating room and surgeon The business analyst must consider several factors
• Dates of each surgery
• Number of minutes the start of the surgery is delayed
• Operating room
• Surgeon name
Which visualization should the business analyst use to meet these requirements?
The sales manager is investigating the relationship between Sales and Margin to determine if this relationship is linear when choosing the dimension Customer or Product Category
The sales manager wants to have the potential percentage Sales tor each Stage (initial to Won) of the sales process
What are the two correct visualizations?
The VP of Sales asks a business analyst to include a KPI object on the sales dashboard that shows total sales value for the year 2022, regardless of selections. Existing fields in the data model include Sales and Year.
How should the business analyst write the measure for the KPI object?
A customer is developing over 100 apps, each with several sheets that contain multiple visualizations and text objects. The customer wants to standardize all colors used every object across every app. The customer also needs to be able to change these colors quickly, as required.
Which steps should the business analyst take to make sure the color palette is easily maintained in every app?
A project management team uses an app to monitor different projects.
• Projects may have co-dependent tasks and processes
• Some projects include subtasks
The business analyst needs to use a diagram similar to a workflow with the processes and the sub tasks represented as boxes with lines to relate them to each other. The color of the boxes could also be determined by the status of each project or task.
Which visualization should be used?
A business analyst needs to create two side-by-side charts for a sales department with the following data:
• Number of orders
• Name of the customer
• Percentage of margin
• Total sales
The charts use a common dimension, but each chart has different measures. The analyst needs to create a color association between the two charts on the dimension values.
Which action should the business analyst take?
A clothing manufacturer has operations throughout Europe and needs to manage access to the data.
There is data for the following countries under the field SACOUNTRY - > France, Spain, United Kingdom and Germany. The application has been designed with Section Access to manage the data displayed.
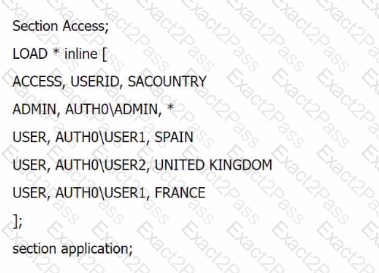
What is the expected outcome of this Section Access table?

