Last Update 23 hours ago Total Questions : 100
The Qlik Sense Business Analyst Certification Exam - 2022 content is now fully updated, with all current exam questions added 23 hours ago. Deciding to include QSBA2022 practice exam questions in your study plan goes far beyond basic test preparation.
You'll find that our QSBA2022 exam questions frequently feature detailed scenarios and practical problem-solving exercises that directly mirror industry challenges. Engaging with these QSBA2022 sample sets allows you to effectively manage your time and pace yourself, giving you the ability to finish any Qlik Sense Business Analyst Certification Exam - 2022 practice test comfortably within the allotted time.
Refer to the exhibit.

An app that will track experiments for rodents (e.g., rats and mice) that navigate mazes (labyrinths) is being developed. Individual rodents are catalogued in the Rodent table, while the Mazes table has metadata for the mazes. The MazeEscapes table holds a record of each attempt at a maze by a rodent. A business analyst needs to build a KPI that will allow users to see how many rodents have made at least one attempt at any maze.
How should the analyst construct the KPI?
The sales manager is investigating the relationship between Sales and Margin to determine if this relationship is linear when choosing the dimension Customer or Product Category.
The sales manager wants to have the potential percentage Sales for each Stage (Initial to Won) of the sales process.
Which visualizations will meet these requirements?
A company CFO has requested an app that contains visualizations applicable to analyzing the finance data. Each regional finance team will analyze their data and should only have access to the data in their region. The app must contain a high-level sheet that navigates to relevant detail sheets.
Which features support a logical design structure?
The CEO has requested a dashboard that tracks the company's performance. The main requirements for the dashboard:
• Minimal number of visualizations or objects
• Display multiple key measures
• Ability to easily navigate to other sheets
Which features would meet the requirements?
A customer needs to distribute sales data to a variety of teams. The internal analyst team requires a global view of data. The sales team requires mobile device access.
Which solution will meet the needs of both teams?
A company has sales data where every Customer ID can be assigned to one or more Sales Account ID. Sales Accounts are assigned to one of eight Groups. The business analyst is creating an app with the following requirements:
• Each Group should have a separate sheet
• The Sales Account can only see its own customers
• The Sales Account can navigate only to the sheet for the Group assigned
The business analyst has created a Section Access table, in which each Sales Account ID is assigned their CustomerlDs. Which action should the business analyst take next?
A business analyst designs a visualization to analyze a count of products by fixed price ranges. The customer now wants the price ranges to be dynamically modified so they are configurable by the application users. The business analyst modified the dimension axis on the visualization.
Which step should the business analyst complete next?
Refer to the exhibit.
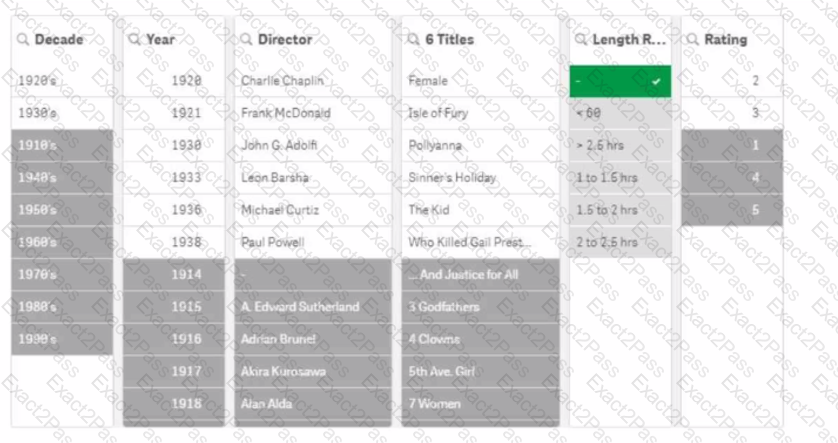
A movie analyst is using an app to gain insights into films created in the early 20th century. The analyst reviews the filter for Length Range, notices a hyphen "-", and selects it.
What can the analyst determine from the resulting filter panes?
A data analyst is working on a new Qlik Sense application and realizes that some of the required data sources have already been used in previous applications. To streamline the data loading process and maintain consistency, the analyst decides to leverage existing data connections.
What actions should the analyst take to utilize the pre-existing data connections in Qlik Sense?
A business analyst is creating a new app with sales data. The visualizations must meet several requirements:
A Bar chart that shows sales by product group is used in multiple sheets
• A KPI object that visualizes that the total amount of sales is used once
• A Treemap that shows margin by product group is used one time inside a Container
Which visualization should be added to the master items library?

