Last Update 23 hours ago Total Questions : 100
The Qlik Sense Business Analyst Certification Exam - 2022 content is now fully updated, with all current exam questions added 23 hours ago. Deciding to include QSBA2022 practice exam questions in your study plan goes far beyond basic test preparation.
You'll find that our QSBA2022 exam questions frequently feature detailed scenarios and practical problem-solving exercises that directly mirror industry challenges. Engaging with these QSBA2022 sample sets allows you to effectively manage your time and pace yourself, giving you the ability to finish any Qlik Sense Business Analyst Certification Exam - 2022 practice test comfortably within the allotted time.
A business analyst ;s creating an app tor the team. A set of selections must be applied every time an app is opened.
What should the business analyst do to meet this requirement?
A business analyst needs to develop a visualization that compares performances of every product the company sells and each product category. The CEO wants to highlight the worst- and best-performing products and categories in a meeting that beg/is in one hour Using a bar chart which two approaches should the business analyst use? (Select two.)
A business analyst needs to create a master item from an object m an app After right-clicking the object the analyst notices the Add to master Items option is NOT available. What should the business analyst do to fix this issue?
Refer to the exhibit.
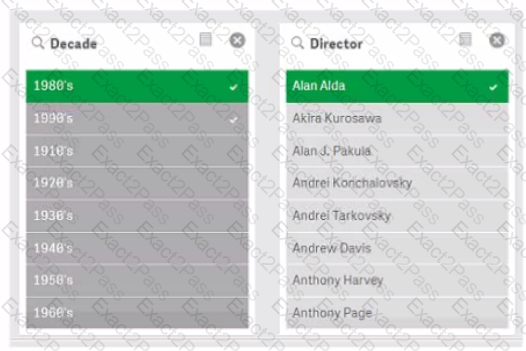
What is the selection slate of light gray values?
Country
USA
US
U.S.A.
Refer to the exhibit.
A business analyst needs to load several data files and notices that some of the values for the United States of America are formatted inconsistently.
What should the business analyst do?
A business analyst is creating an app that requires several visualizations
• A scatter plot mat shows the margin percentage and total sales by product category
• A map with a the layer that visualizes lines between retail stores and lactones
• A KPI that shows total cost
Margin% can be calculated by dividing profit by revenue Profit is the difference between total cost and total sates
Which two sets of fields can the business analyst use to meet these requirements? (Select two.)
A business analyst is creating an app for the sales department
Users of the app most be able to create sheets and analyze data The sales department has several additional requirements
• Reuse the global sales visualization
• Create new visualizations
• The app has over 100 visualizations
Users will NOT have access to the full data model
What should be added to the master items to meet the requirement?
A Help Desk department sets a first-time fix target of 65% for ail customer calls. The department has a measure that captures the actual first-time fix percentage. A business analyst needs to choose the visualization that most effectively shows the performance against the target using a color gradient Which visualization should the business analyst use?
A customer wants to perform a regional sates analysis to learn how products set over time m different areas The business analyst needs to design a sheet in the app tor business users to perform several tasks
• Select two different groups of countries to study
• Compare sales over time between these two groups using a bar chart
• Change the group items by selecting different countries at any time
• Select a time range in the bar chart and drill-down to daily transactional sales
Which steps should the business anaryst follow to meet these requirements?
A user makes a selection within a sheet and then navigates to another sheet to validate the details However when the user returns to the original sheet the selection is removed What is causing this behavior?

