Last Update 6 hours ago Total Questions : 396
The CompTIA Data+ Certification Exam content is now fully updated, with all current exam questions added 6 hours ago. Deciding to include DA0-001 practice exam questions in your study plan goes far beyond basic test preparation.
You'll find that our DA0-001 exam questions frequently feature detailed scenarios and practical problem-solving exercises that directly mirror industry challenges. Engaging with these DA0-001 sample sets allows you to effectively manage your time and pace yourself, giving you the ability to finish any CompTIA Data+ Certification Exam practice test comfortably within the allotted time.
A data analyst needs to calculate the mean for Q1 sales using the data set below:
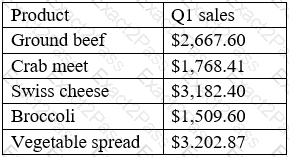
Which of the following is the mean?
An analyst is designing a dashboard that will provide a story of the sales and sales customer ratio. The following data is available:
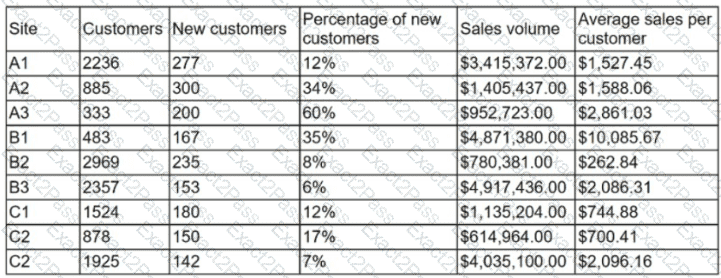
Which of the following charts should the analyst consider including in the dashboard?
A customer list from a financial services company is shown below:
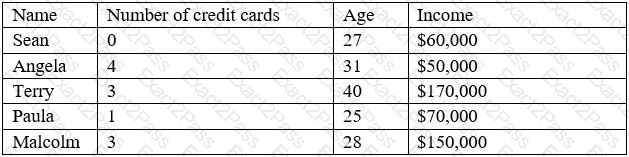
A data analyst wants to create a likely-to-buy score on a scale from 0 to 100, based on an average of the three numerical variables: number of credit cards, age, and income. Which of the following should the analyst do to the variables to ensure they all have the same weight in the score calculation?
Which of the following best describes a difference between JSON and XML?
Which of the following BEST describes standard deviation?
Which of the following activities occurs during the ETL process?
Given the diagram below:

Which of the following types of sampling is depicted in the image?
Given the below:

Which of the following numbers represents a Type I error?
Kelly wants to get feedback on the final draft of a strategic report that has taken her six months to develop.
What can she do to get prevent confusion as see seeks feedback before publishing the report?
Choose the best answer.
When analyzing the values of two variables, you decide to convert both variables so they are on a scale of 0 to 1.
What term describes this action?

